Inflation Decelerates Significantly to Under 2% and the Fed Reduces the Funds Rate in 2023
The Trends in CPI are Obvious1
- Food has been slowing for 2 months in a row.
- Energy is tanking, matching the roundtrip seen in oil, diesel, gasoline, and even natural gas.
- The rate of used cars is falling -36%.
- Shelter has slowed visibly and now matches the downtrend of other market-based measures of home prices and rents. Yet, year-over-year, shelter rose to 7.1%, a new high. Month-to-month was also up 0.6%, despite declining rent and home prices in November.
- Medical care is falling at a rate of -40% and repeatable due to the annual adjustment (see earlier CPI reports).
- Annualized core CPI is now 2.4% versus 3.6% last month.
- Annualized core inflation is now down to 4.18%, from 5.56% last month.
Table I
CPI Forecast Next 12 Months
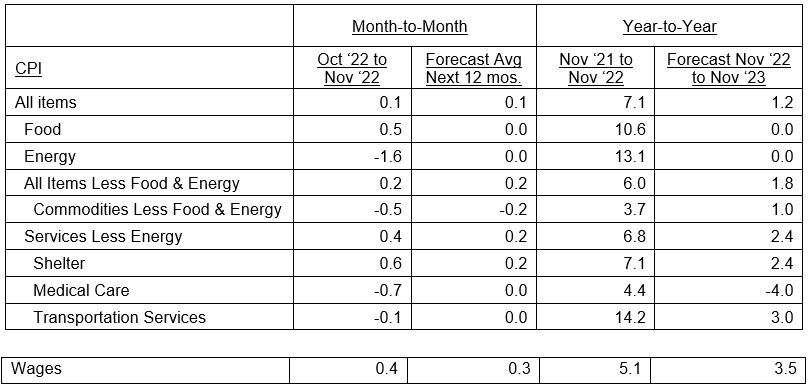
The Fed’s favorite, November Core CPI rose 0.2%, or at a 2.4% annual rate for the October to November period. The forecast of the future average monthly change in CPI and its components was determined by the change in year-over-year CPI ending November 2022, versus the forecast for November 2023. The year-ahead year-to-year change is a forecast based in the leading indicator illustrated for each major CPI component below.
Food Prices to Slow Dramatically
Even food CPI is set to rollover. The FAO (of UN) Food Price Index has been declining for 8 consecutive months, and year-over-year is now down to +0.3% from +40%, a massive deceleration. As FAO leads food CPI by 7 months, the implication is that food CPI will slow dramatically from +11% to 4% in June and zero by the end of 2023 (see Charts I & II).
Chart I
Food Inflation: FAO Food Prices Decelerate
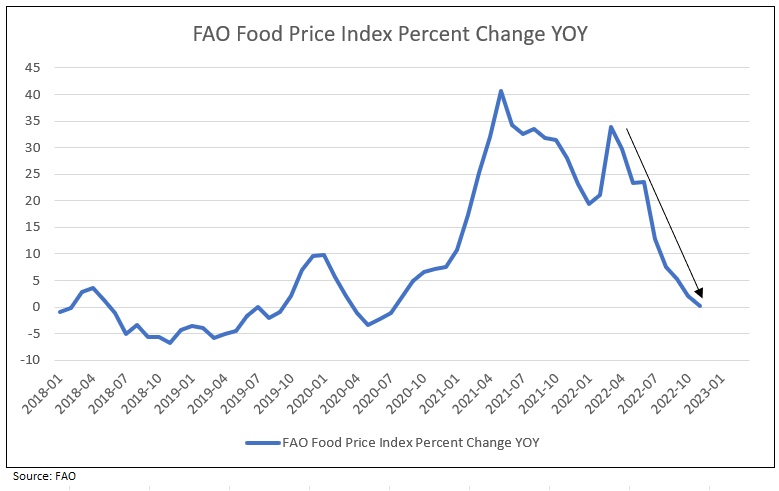
Chart II
Growth in FAO Food Price Index Advanced 7 Months Since 1991

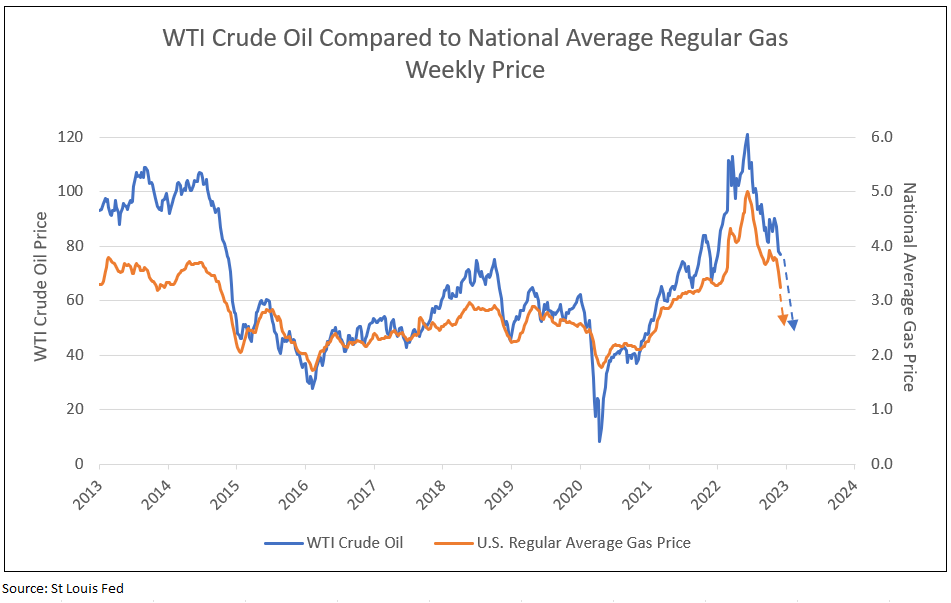
Sharp Decline in Gas Prices
WTI crude oil peaked in May 2022 at $114.67, sharply declined in September to $76.41, increased in October to $92.64, and fell again in December to $77 (see Chart III). The national average regular gasoline price rose from $3.43 a year ago, to a peak of $5.02, and declined to $3.24 as of December 12, 2022.
The price of crude is forecast to decline to $70 or below, reducing gasoline prices below $3.00 in early 2023. Year-over-year gasoline price growth, therefore, will be negative for most of 2023, when comparing the lower forecast prices for 2023 to the peak price highs of 2022.
Chart III
WTI Crude Oil vs National Average Regular Gasoline Prices
The Sticky Component of Rent, a Lagging Indicator, Will Retreat from Over 7.0% to Under 4% by March 2023 and to 2% by January 2024
Rent component is measured by rent from primary residence (7.4% of CPI) and owners’ equivalent rent (OER, 24.0% of CPI) for a total of 32.6% of CPI, and 41.7% of Core CPI. Rent and OER are best forecast by the NAHB/Wells Fargo Housing Market Index (HMI) with a 17-month lead time.
HMI is based on a monthly survey of NAHB members designed to take the pulse of the single-family housing market. The survey asks respondents to rate market conditions for sale of new homes at the present time and in the next six months, as well as the traffic of prospective buyers of new homes.
HMI peaked in November 2020 at 90 and has fallen like a rock, hitting 33 in November. HMI forecasts year-over-year monthly change in rent and OER. As a result, the sharp declines in HMI in 2022 with a 17-month lead time forecasts a year-to-year change of 2.4% by November 2023 and 1.4% rent and OER inflation by January 2024 (see Charts VI and VII).
As illustrated below, the housing market index (HMI), measuring a series of current housing indicators as well as realtor’s sentiments, and with a 17-month lead time, forecasts huge declines in growth of rent components of CPI into early 2024 (see Charts I and II). The year-over-year growth in rents measure from Zillow and Apartment List are declining sharply, with Apartment List declining below the BLS rent measurements (see Chart III). Yet, year-over-year shelter CPI for November rose to 7.1% from 6.9% reported in October, which makes no sense, or, as Professor Jeremy Siegel indicated, is “ridiculous.”
Chart IV
Following the Lead of HMI, Rent Percent Change “Falls Like a Rock” in 2023 and 2024
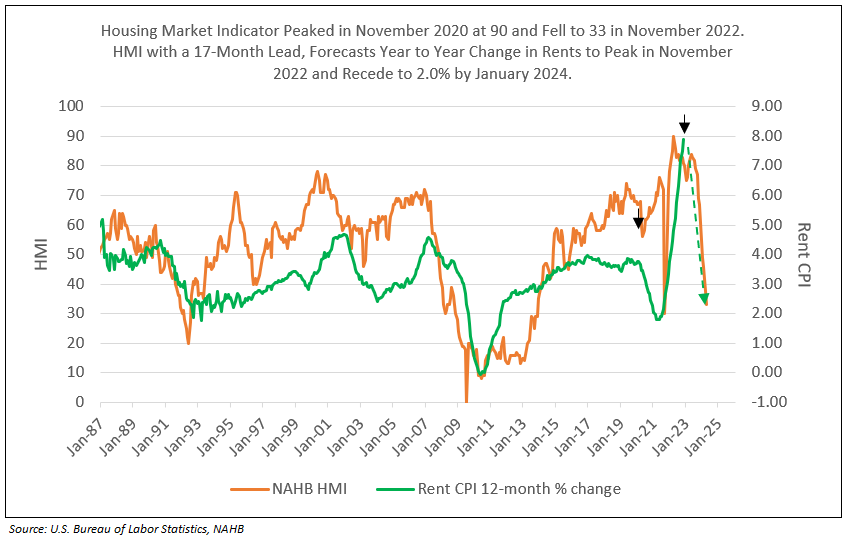
Chart V
Following a Decline in HMI, OER Percent Change “Falls Like a Rock” in 2023 and 2024
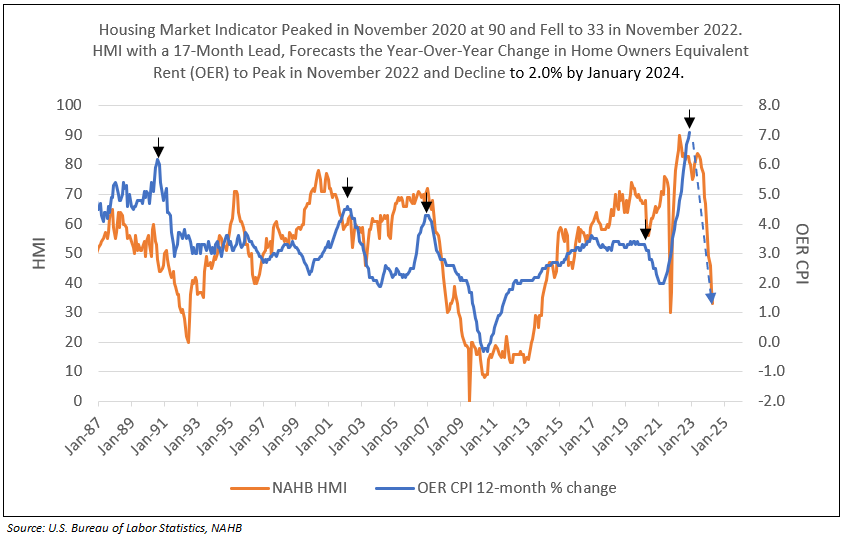
Chart VI
Rent Indicators Decelerate

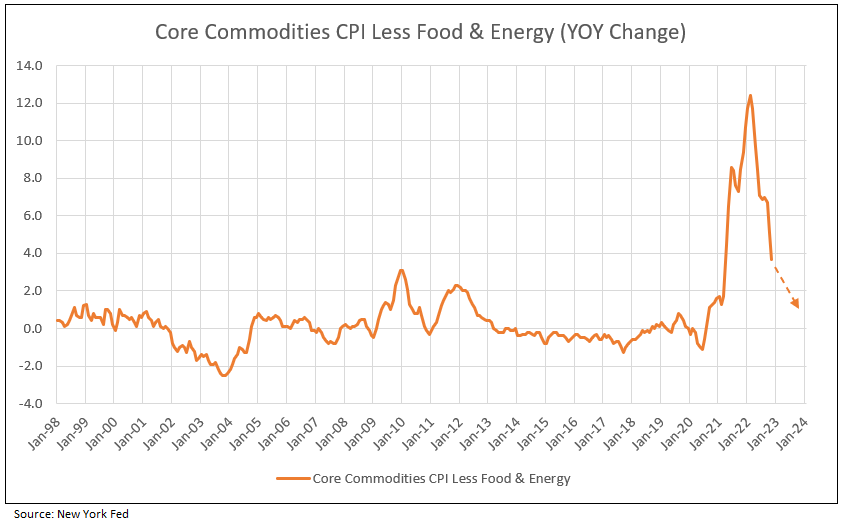
Core Commodities Less Food and Energy
In recent years core commodities or goods excluding food and energy were impacted by the backups in the supply chain, both internationally and domestically. As illustrated in Chart VII, core commodities (goods) less food and energy peaked at over 12% and declined to 3.7% in November 2022 and are expected to recede to 1.0% by October 2023.
Chart VII
CPI Core Commodities Goods Versus Global Supply Chain Pressure Index (GSPCI) Core Commodities
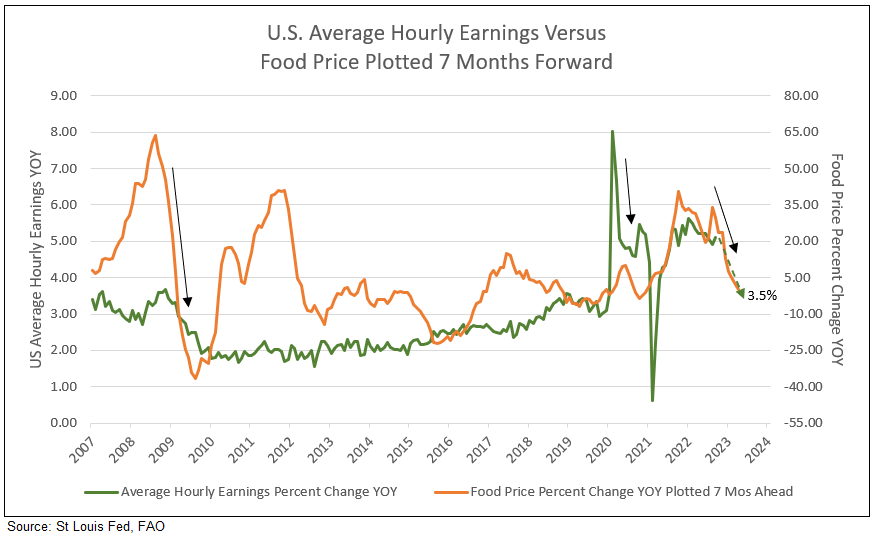
Labor Costs Decelerate
Wage growth peaked in 2022 at 5.6% and is expected to recede to 4% in 2023. As noted above, growth in FAO World Food Price is at a peak of 4.0% in 2022, and down to 0.3%. U.S. Food CPI peaked at over 11% in 2022 and registered at a 10.6% year-over-year increase in November. FAO Food Price growth forecasts 2% U.S. CPI food inflation by year-end 2023. Energy CPI in November 2022 was 13.1% compared to a year earlier and forecast to decelerate to zero in 2023.
Both food and energy prices are major drivers of wages, which are forecast to recede from 5.1% rate in December 2022 to 3.5% at year-end 2023. Real wage growth could well exceed 2% in 2023 (see Table I).
Chart VIII
Employment Cost Index and Food & Energy CPI Year-to-Year Growth
Implied Inflation Forecast
Current indicative values for Inflation Expectations Indexes can be found in the table below, set alongside historical indicative data points from June 7 and January 11, 2022.
Table II
Current indicative values for US Dollar Inflation Expectations Indexes

All implied inflation rates are at or below 2.5%.
Conclusion
Almost all forecasters are predicting “Recession” in 2023. The sharp decline in top line CPI and core CPI to levels below wage growth in 2023 limits the impact of recession and may result in no recession.
At play in the tension between Fed communication and investors are two distinct visions about the post-pandemic economy. Our view of the traders in the markets shows a credible central bank quickly putting inflation, with its lagging characteristics, on a path to its 2% goal, with the help of a mild recession, or dis-inflationary forces, that keep prices low for decades. A competing view is one that believes supply constraints will be an inflationary force for months and perhaps years.
The current Fed funds futures curve peaks in July 2023 at under 5% and the Fed funds rate recedes to 4% in late 2024. Conversely, traders forecast the curve to peak under 5% in March 2023 and the funds rate to recede to 3.5% in 2024.
1 Tom Lee on FS Insight, Dec. 13, 2022
Let IDC provide you the value and financial history of your favorite bank stock. For you to better understand our process of valuation, we offer a free, one-time analysis of one of the 202 banks in our bank analysis database. Simply send your request with the bank stock symbol to info@idcfp.com.
To inquire about IDC’s valuation products and services, please contact jer@idcfp.com or info@idcfp.com or call 262-844-8357.
John E Rickmeier, CFA
President
Robin Rickmeier
Marketing Director