Core CPI Inflation Peaked and Declines Toward 3.5% by March 2023 and 2.5% by Early 2024
The combined components of CPI could slow core CPI to a positive 0.3% month-over-month through March 2023. Core CPI year-over-year could well recede toward 3.5%, by March compared to 6.5% registered in 2022 to date. Core should decline further to 2.5% in early 2024.
Key Takeaways
- Rent price figures due to cool in the months ahead. That’s because the Labor Department’s measure of rent at large is paying – both those who just signed leases, and those who signed a while ago. As a result, it lags changes in rents for newly signed leases. As noted from data from Zillow and Apartment List, rent prices are decelerating (see Chart VII). Real Page reported that apartment rent fell 0.6% in October from September which is the third largest drop since 2010.1
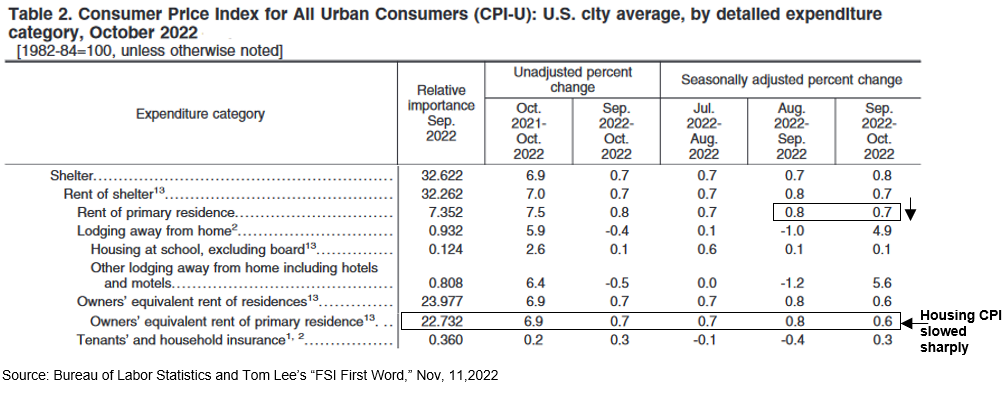
As Professor Jeremy Siegel has emphasized, if the current decline in rents and home prices were computed into CPI shelter costs, the housing component would be negative month-to-month and under 3.0% year-over-year. Shelter equals more than 40% of core CPI. Current housing components are reported 0.6% to 0.7% month-to-month and 6.9% to 7.5% year-over-year (see shelter details below).
- Medical health insurance fell sharply to -4.0% month-over-month from consecutive months at 2.4% (since October 2021) and with annual adjustment forecast to decline 40% over the next 12 months (see below for further explanation).
- Durable goods finally snapped back as durables CPI fell -0.7% month-over-month (-8.4% annualized) and even used cars finally showed weakness, down 2.4% for the month with an additional 15% decline expected in the coming months.
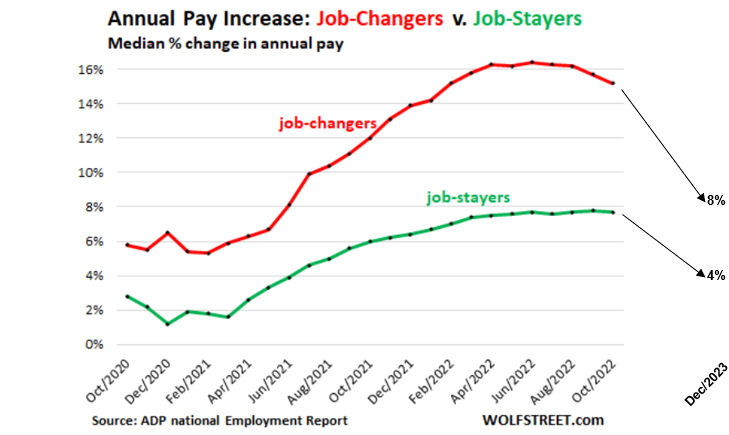
- Given the decline in core CPI in 2023, annual pay increases decelerate. “Labor market rebalancing is already lowering wage growth, particularly in sectors with large declines in the job-workers gap such a retail and leisure.” Wage growth is expected to fall by 1.5 percentage points to 4% by late 2023.2
- Given a strong GDP growth in the fourth quarter of 2022 and Fed requirements for positive year-over-year growth in M2 money supply, M2 expands from the estimated $21.38B in October to $21.79B in March, which favors a rising stock market. Declining core CPI year-over-year and positive money supply M2 growth supports rising equity prices in the stock market.
In a note published over the weekend, Goldman’s economic research team, led by Jan Hatzius, confirmed the current and past forecasts by IDCFP for a significant slowdown in core CPI inflation in 2022 and 2023. Goldman forecasts the closely watched core measure by the US central bank to drop from the current level of 5.1% to under 4% by the middle of 2023.
The Sticky Component of Rent, a Lagging Indicator, Will Retreat from Over 7.0% to Under 4% by March 2023 and to 2% by January 2024
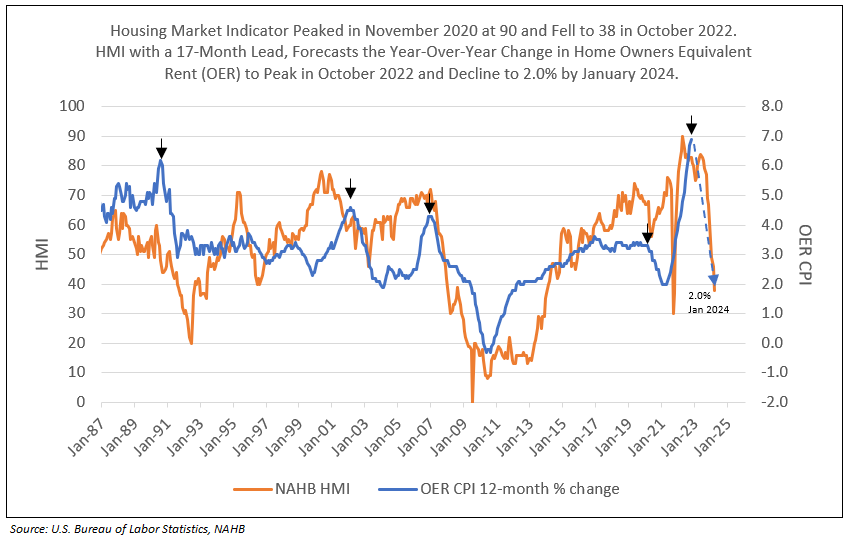
Rent component is measured by rent from primary residence (7.4% of CPI) and owners’ equivalent rent (OER, 24.0% of CPI) for a total of 32.6% of CPI, and 41.7% of Core CPI. Rent and OER are best forecast by the NAHB/Wells Fargo Housing Market Index (HMI) with a 17-month lead time.
HMI is based on a monthly survey of NAHB members designed to take the pulse of the single-family housing market. The survey asks respondents to rate market conditions for sale of new homes at the present time and in the next six months, as well as the traffic of prospective buyers of new homes.
HMI peaked in November 2020 at 90 and fell like a rock to 38 in October 2022. With the 30-year mortgage rate increasing to 7%, a further decline in HMI is projected for November. Plotted 17 months forward, HMI forecasts year-over-year monthly change in rent and OER. As a result, the sharp declines in HMI in 2022 with a 17-month lead time forecasts 2.0% rent and OER inflation in January 2024 (see Charts VI and VII).
As illustrated below, the housing market index (HMI), measuring a series of current housing indicators as well as realtor’s sentiments, and with a 17-month lead time, forecasts 2% growth in rent components of CPI for early 2024 (see Charts I and II). The year-over-year growth in rents measure from Zillow and Apartment List are declining sharply, with Apartment List declining below the BLS rent measurements (see Chart III).
Chart I
Following the Lead of HMI, Rent Percent Change “Falls Like a Rock” in 2023 and 2024
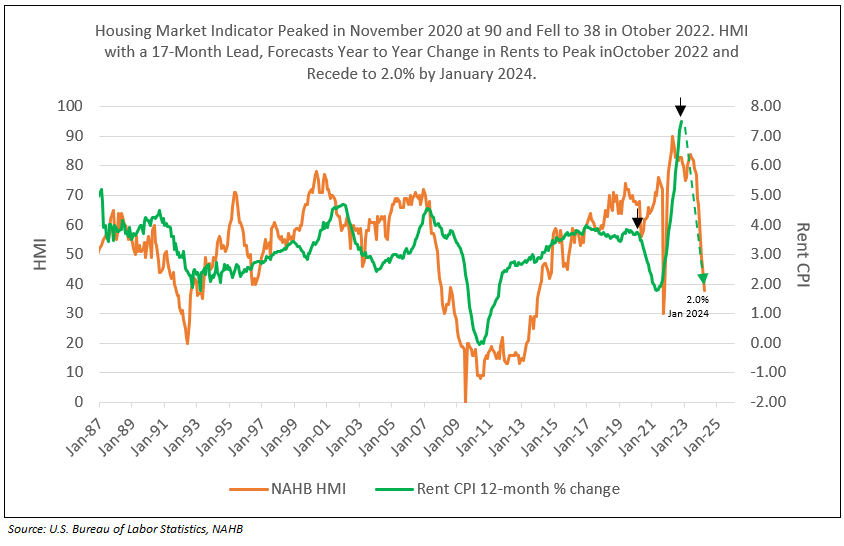
Chart II
Following a Decline in HMI, OER Percent Change “Falls Like a Rock” in 2023 and 2024
“The Absolutely Ridiculous Inflation Measurement” – Jeremy Siegel
In the Powell press conference, a reporter asked, “which housing inflation indicator do you rely on?” Dr Siegel reiterated his past concerns as to the 17-month lagging nature of the BLS measure of rent and rent equivalent for home ownership, versus the current reported rent data for Zillow or Apartment List as well as home selling prices. Powell indicated they use the BLS data, which represents over 40% of core CPI, a major concern for Dr. Siegel (see Chart III and Table I).
Chart III
Rent Indicators Decelerate3
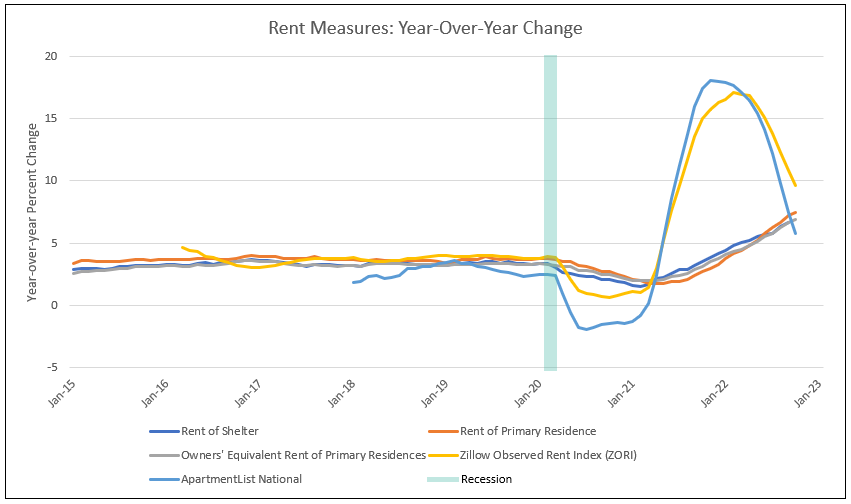
The rapid deceleration in current prices of rent and shelter assist in forecasting the rapid decline in the CPI rent components in 2022 and 2023.
Table I
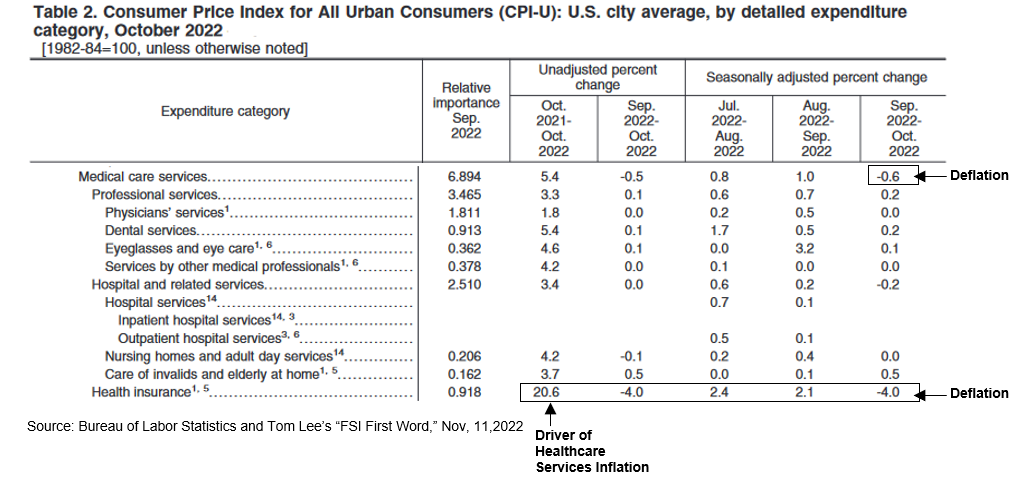
CPI Healthcare Services a Primary Driver Declines from 1.0% Month-Over-Month in September to -0.6 in October
- · Month-over-month medical services inflation fell from 1.0% in September to -0.6% in October.
- · Month-over-month health insurance inflation declined from 2.1% in September to -4.0% in October
Health care inflation downshifted in part due to a drop in health insurance prices in the CPI. This component often exhibits large swings in September or October, when the BLS adjusts health insurance prices to reflect industry data on retained earnings. These reflect premiums retained by insurance companies after paying out benefits (primarily a function of utilization).4
At a simplistic level, the health insurance CPI surged 28% over last September, adding 0.2 percentage points to headline inflation. This was because utilization fell in 2020 as the pandemic deterred people from “normal” health care services without a corresponding drop in plan premiums, causing the “price” of health insurance to surge. (Because of lags in reporting, the 2020 changes impacted the CPI data starting in October 2021).4
Health care utilization rebounded last year, however and 2021 retained earnings dropped. Therefore, CPI for health insurance fell for the year starting in October, reducing month-to-month health insurance inflation from 2.1% in September to -4.0% in October (see Table II). Given the annual adjustment, health insurance inflation is set to fall 40% over the next 12 months. “Part of the weakness will be outset by an increase in healthcare inflation as a reflection of the largest medical fee update in at least 15 years.”2
Table II
Deflationary Goods Prices
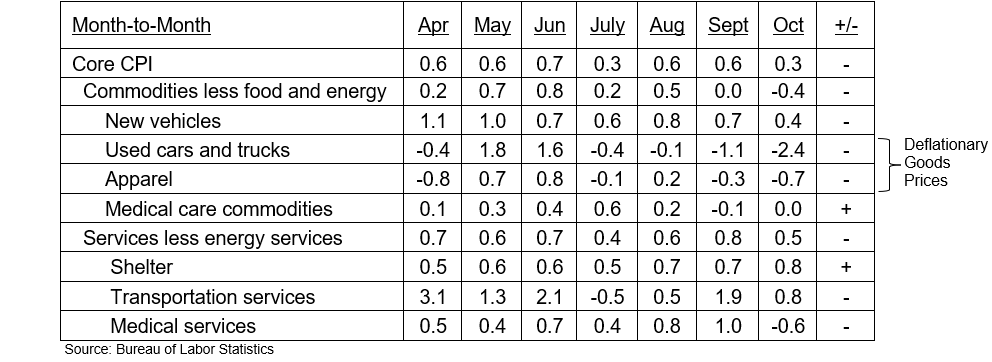
The easing of supply chains coupled with growing inventories reduced goods prices. Used cars finally reflected soft prices, declining 2.4% in October. Apparel with pre-orders provided discounts, declining 0.7%. New vehicles prices sharply decelerated, going from 0.8% in August, to 0.7% in September, to 0.4% in October (see Table III).
Table III
Percent Change in Core CPI for All Urban Consumers
Sticky Wage Inflation
The explosion of job openings last year, and the still huge unmet demand for labor depicted by these job openings currently, along with the very tight supply of labor, as seen by the labor force data, speak of the supply-and-demand imbalances currently in the labor market.5
We can see the effects of aggressive hiring – such as offering higher wages, better benefits, improved working conditions – which turns into poaching workers from other employers, which creates that massive churn in the labor market that we can see in the historic number of workers who voluntarily quit their jobs because then can get a better job.5
And this aggressive hiring also brings the self-employed onto the formal payrolls.
And the payroll data from ADP showed just how huge the wage gains were for people who quit their job to get a better job. For overall private-sector employees, the median annual increase in pay amounted to 7.7% for the “job-stayers” and to 15.2% for the job-changers.5 (See Chart IV).
Chart IV
Growth in Wage Inflation Decelerates with Core CPI
Year-Over-Year US Growth in M2 Approaches Zero Despite Acceleration in Bank Loans
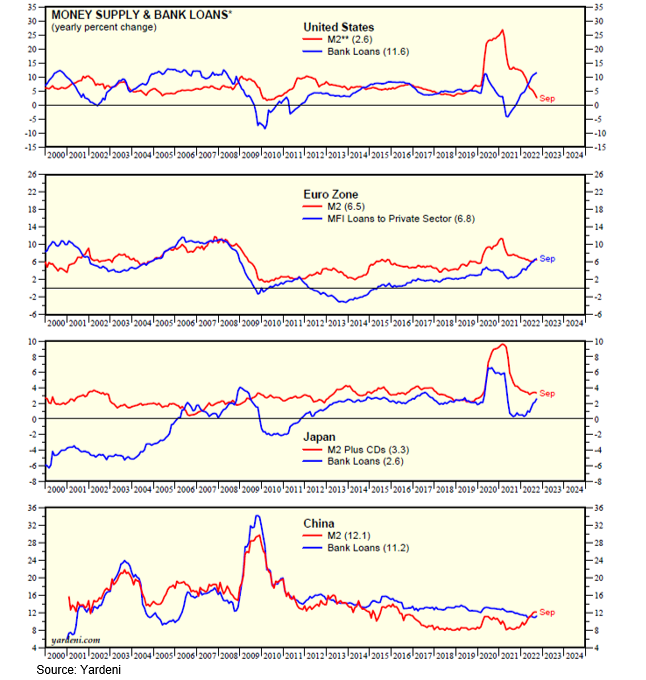
Since 1945, year-to-year growth in monthly M2 money supply has never fallen below zero (see black line in Chart V). In October of 2022, M2 Money Supply year-over-year growth is expected to decline to zero (see Chart VI and VII). Given year earlier M2 money supply rose in December 2021 and early 2022, the Fed, to maintain zero year-over-year growth, must again expand its balance sheet temporarily, thereby increasing M2 to prevent negative M2 growth (see Chart VII). US M2 growth approaches zero despite a significant acceleration in bank loan growth (see Chart VIII).
Chart V
Monthly Year-Over-Year M2 Money Supply Growth Remained Positive Since 1945
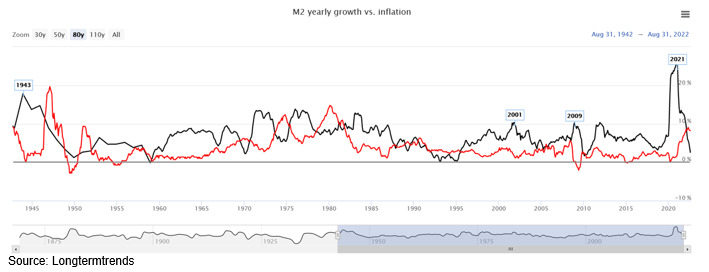
Chart VI
M2 Money Supply Growth Vs Inflation
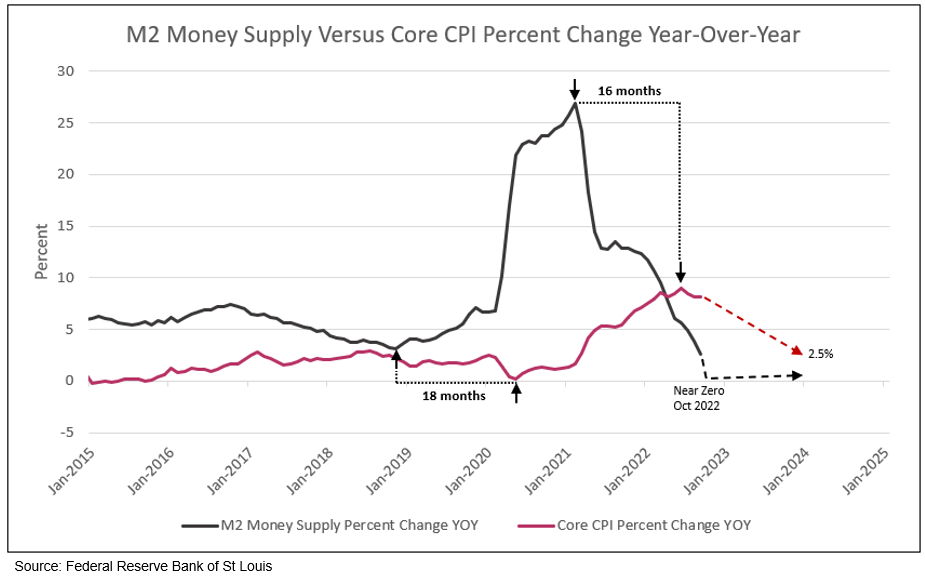
Chart VII
Fed Allows M2 Money Supply to Increase Through March 2023 to Maintain Positive Year-Over-Year Growth

Chart VIII
Global M2 Growth and Bank Lending
M2 money supply growth has accelerated from 3.2% in October 2018 to 26.9% in February 2021, the highest in 150 years. In the second quarter of 2020, M2 accelerated above 20%, but the Fed failed to raise the Fed funds rate to control potential inflation in 2021 and 2022, which was the Fed’s mistake.
Following its peak at over 26.9%, M2 money supply made a round trip and fell to 2.6% in September 2022. Based on the 16-month lead time, CPI inflation then peaked at 9.0% in June 2022 and is expected to recede to under 3% by the end of 2023 (see Chart II). Given this outlook, why would the Fed continue to raise the Fed Funds rate above 4.5% later this year and in early 2023? Is the Fed about to make another mistake?
Raising the Fed funds rate to 4.5%, while reducing its balance sheet at the current rate, will result in negative year-over-year growth in M2 money supply — an event that has not occurred since 1945, but did occur in the depression of the 1930s.
Since 1945, the Fed has not allowed negative year-over-year growth in M2. If the Fed fails to increase M2 through the repo market or by increasing its balance sheet in the near-term, M2 will show negative year-over-year growth through March 2023. If the Fed responds and provides positive growth in M2, the rise could spark a stock market recovery into year-end and the first quarter of 2023. By March 2023, further evidence of the major decline in inflation should be apparent.
Buy Equities
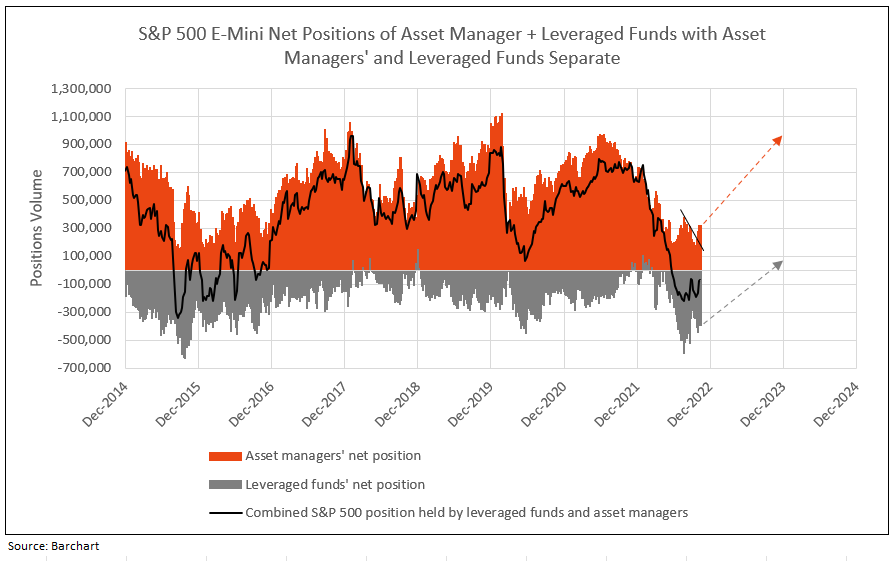
The past recommendation was to buy equities on weakness. The fears of inflation and the Fed’s actions, both in open media campaigns from Fed Chairman Powell, other regional presidents, and actions of the open market committee, together, created fear of a potential recession, driving stocks into a bear market in the first half of 2022, leading to a cycle low on June 16. Asset managers represented their bearish view by reducing net long positions in the Mini S&P 500 futures from almost 1 million in mid-2021 to 200,000 in June 2022.Leveraged funds increased the net short Mini S&P 500 futures position from zero at year-end 2021 to a record short position in August 2022, equal to the September 2015 levels. In September 2022, the leveraged funds reduced the net short position in half, a bullish trend (see Chart IX).
The levels of 1 million for asset managers and zero or higher for leveraged funds called the market peaks in February 2018, February 2020, and year-end 2021. The max negative levels of net short positions for leveraged funds called the stock market cycle lows in 2015, 2018, 2020 and especially in August 2022. In most cases, the cycle low in asset managers’ net long positions matches the extreme negative net short positions of leveraged funds. Note, however, asset managers’ positions bottomed following the June stock market low but leveraged funds did not reach its record low until mid-August 2022.
The record low in negative leveraged fund net short positions in September 2015 did not reach zero until February 2018 (a 3-year bull market). The next major net short low in the second quarter of 2020 did not reach zero until the end of 2021 (a 21-month bull market). The recent major low and reversal in leveraged fund positions forecasts a potential for a bull market in equities through 2023 (see Chart IX).
Chart IX
1 The Inflation Countdown is Finally Here, WSJ, 11/10/2022
2 Goldman Sachs sees inflation 'finally falling' in 2023, with core prices set to drop under 3% as wage growth slows, Business Insider, 11/14/2022
3 Calculated Risk blog
4 Global Data Watch, JPMorgan, 10/21/2022
5 Has this Contorted Labor Market Forced Companies to Change their Thinking about Layoffs?
Wolf Street, 11/4/2022
6 Money & Credit: Global M2 Growth & Bank Lending, Yardeni, 10/28/2022
To inquire about IDC’s valuation products and services, please contact jer@idcfp.com or info@idcfp.com or call 262-844-8357.
John E Rickmeier, CFA
President
Robin Rickmeier
Marketing Director
