Problems to Be Resolved in the Bond and Stock Markets
The Liquidity Problem
With the futures market indicating a 4.9% Fed funds rate by May 2023, the 2 through 10-year Treasury notes dramatically increase in order to price the Fed funds expectations. The stock market remains highly correlated to the 10-year T-Note yield, falling or rising in value as the yield increases or decreases.
When traders in the “24 trillion US Treasury market are having trouble trading, it’s a matter for far wider concern.”1 Liquidity metrics are flashing at crisis levels.
- The Bloomberg US Government Securities Liquidity Index – a gauge of deviations in yield from a fair value model – remains near the highest level since March 2020.
- The liquidity problem is a function of steep losses on bonds caused by stubbornly rising inflation, resulting in traditional big participants, like US commercial banks, foreign governments, and life insurers, to shy away from debt markets.
- The Fed is currently offloading its Treasuries from its balance sheet at a pace of $60 billion a month, compounding the problem.
- To improve liquidity, the US Treasury will potentially buy back older securities and replace them with larger current issues, raising the coupon and liquidity in the Repo market. The buyback operation would offer an alternative for less liquid, less desired off-the-run issues.
- Additional liquidity could come from the Fed adjusting the terms of its standing repo facility – where banks can park their treasuries overnight in exchange for cash – to make Treasuries more attractive to hold. Market participants are also hoping for additional changes, such as the Fed exempting Treasuries from the supplementary leverage ratio, or SLR, which requires that banks set aside capital against trading in Treasuries.
The UK-to-US Spread Problem
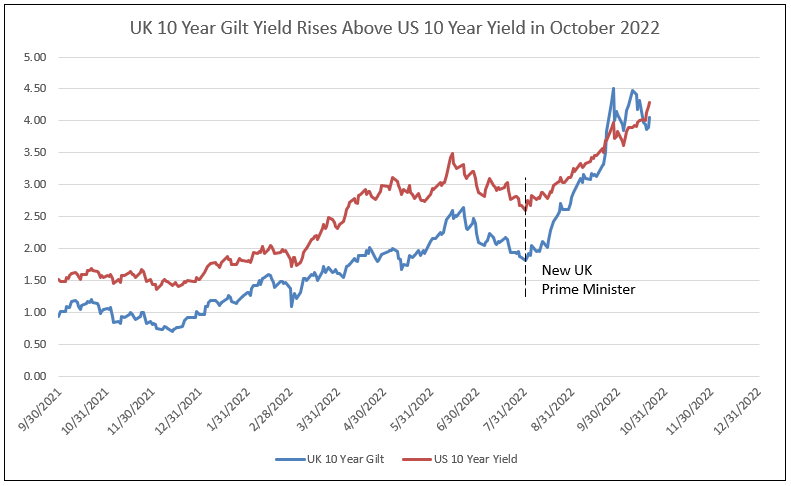
Beginning in August 2022, the UK 10-year Gilt yield closed the spread to the US 10-year yield, and by October UK yields rose above US yields, reflecting the UK’s prime minister and government disaster. Normally, US yields are some 50 to 100 basis points above UK yields (see Chart I).
UK yields have begun to recede to 4% as problems there are resolved, but US yields need to rise above the UK yields in order to maintain appropriate spreads. The push-pull events in the bond market are reflected in the currency market, driving the US dollar to peak levels.
Chart I
The Sticky Inflation Problem
Services inflation less energy services weight is 56.8% of CPI and rose 0.8% in September compared to 0.6% in August. The heavyweight Shelter is 32.5% and rose 0.7% in September. Expectations for shelter inflation was for a sharp decline in the coming months, given the 17-month lead time of the Housing Market Index (HMI). The HMI declined from 90 in November 2020 to 38 in October, forecasting 2% Owners’ Equivalent Rent (OER) and Rent inflation in early 2024 (see Chart II).
Chart II
Shelter CPI Forecast to Decline Sharply in 2023

The growth ratio of rent reported by Zillow and Apartment List must decline below the growth rate in CPI shelter inflation to forecast the peak in OER and shelter rent and a slowing growth rate in CPI shelter. Rent growth from these services peaked in 2021 and early 2022 at over 25%, and have only receded to a 10% annual rate, which is above the 6.7% year-to-year growth in CPI shelter in September (see Chart III).
More importantly, Zillow rent index rose from 2078.5 in August to 2087.1 in September, a 0.29% increase for a 10.8% annual rate of rent inflation. Apartment List’s national rent rate indicated a peak in August at 1,386, falling to 1,383 in September, but still registered at a 7.5% annual growth rate (see Chart III). Rents are stickier than predicted by HMI, creating CPI forecasting problems for the Fed.
Chart III
Current Rent Growth Remains Above Shelter CPI

Implied Inflation Problems
IDC uses a family of inflation indexes:
- 1 Year Expected Inflation (INFL 1Y): Expected inflation over the next 12 calendar months (i.e., the market implied expectation for realized inflation over the course of the next year, starting from the latest published CPI).2
- 4 Year Expected Inflation, 1 Year from Now: Expected longer term inflation in one year’s time (i.e., the market implied four-year inflation expectation one year forward)
- 5-Year Implied Inflation: The market implied five-year market inflation expectation from today.
- 10-Year Implied Inflation: The market implied ten-year market inflation expectation from today.
- 5 Year Expected Inflation, 5 Years from Now: Expected longer term inflation in five years’ time (i.e., the market implied five-year market inflation expectation five years forward).
Inflation Expectations – Re-accelerating Implied Inflation
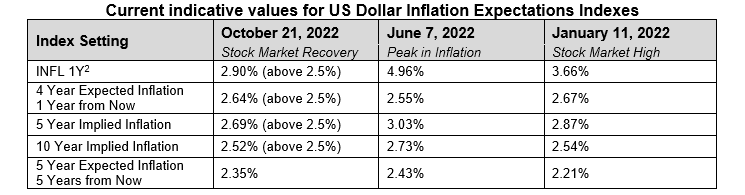
Current indicative values for Inflation Expectations Indexes can be found in the table below, set alongside historical indicative data points from June 7 and January 11 of 2022.
Table I
Current indicative values for US Dollar Inflation Expectations Indexes
How much Reduction in Inflation is Sufficient to Meet the Fed’s Target?
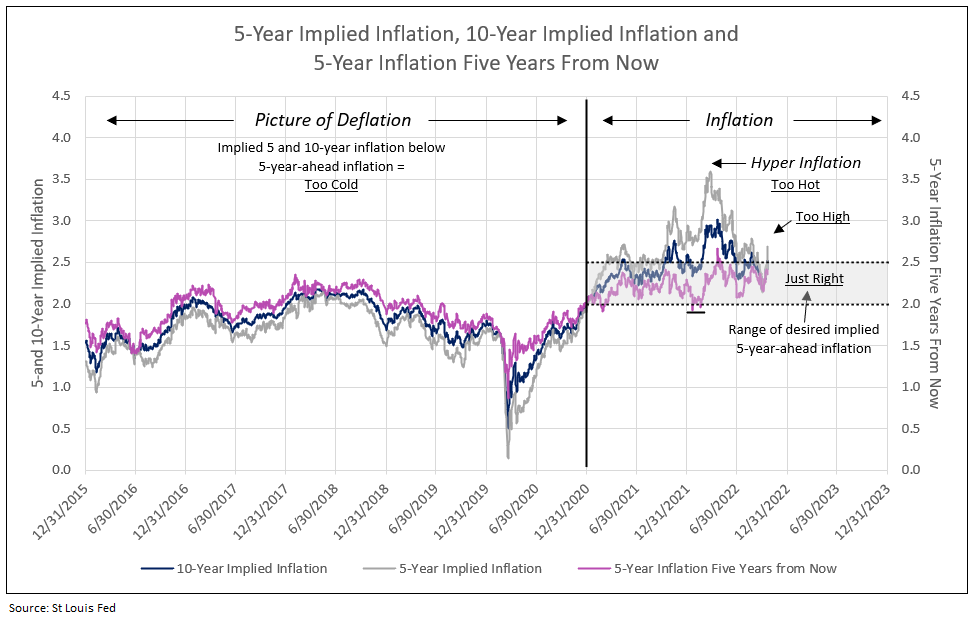
A picture of deflation.
Deflation is illustrated by measures of implied inflation, when the 10- and 5-year implied inflation rates are less than the 5-year rate 5-years in the future. Chart III illustrates the deflation that reigned from 2015 to 2020. The 5-year rate 5-years ahead remained slightly above and, at times, below 2%, while 5- and 10-year implied inflation continuously fell below this 5-year-ahead rate. The Fed does not desire any deflation outcome in the future.
Current picture of uncontrolled inflation.
Inflation is illustrated by 5- and 10-year implied inflation continuously greater than the 5-year-ahead rate. Levels of the 5- and 10-year implied rates above 2.5% are excessive and require Fed action, by both their media campaign and actions of the open market committee.
Implied inflation is again above 2.5%. Five and 10-year yields fell to 2.5% and the 5-year-ahead rate dropped to a little over 2% in the third quarter of 2022. However, today the 1-year implied inflation is at 2.90%, and 4-year inflation one year from now is 2.64%, while 5-year is at 2.69%, 10-year is at 2.52%, and 5-years-ahead inflation rate is at 2.35% (see Charts IV and V).
Chart IV
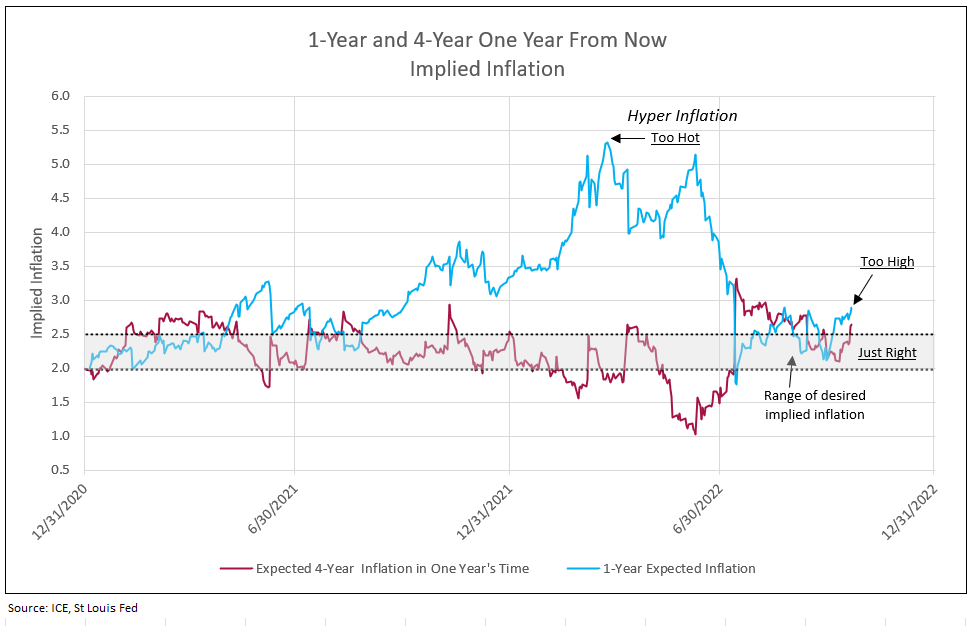
Chart V
All Implied Inflation Readings Decline to Acceptable Levels
The Stock Market Problem
The rise in the 2-year T-Note yield to 4.7% and 10-year to 4.3% creates problems for common stocks. The higher yielding value stocks must compete with the rising yields on treasuries. The growth stocks require a higher discount rate to value future earnings. As a result, this stock market will have difficulty with higher yields until the futures and bond market perceives the Fed is done increasing the rate and markets can determine a peak in the Fed funds rate.
Bonds Will Determine the Direction of Bear Market in Stocks2
We’re witnessing a bear market in US stocks as a play with the possibility of two acts. Act I may be nearing its end (adjusting to higher interest rates), and many investors are looking ahead to Act II (adjusting to lower earnings.) The transition is taking longer than anticipated, however, and some like Yardeni are questioning whether Act II is actually coming.
The surge in Treasury yields has been the main driver of the stock selloff over the last 10 months. The 10-year yield rose to 4.23% on October 20, the highest since 2008. This jump in risk-free rates increases a company’s cost of capital and boost attractiveness of bonds relative to stocks. Yet, the S&P 500 climbed 4.75% over five days even as 10-year Treasury yields increased some 20 basis points.
As yields rise, price-to-earnings ratio will continue to sink, but should soon stabilize, based on interest rates. This should introduce Act II of the bear market, leading to growth. But an average recession brings overall earnings per share down by 31% and this is what a Bloomberg survey of economists is forecasting. Economists’ odds are now at 60% that there will be a recession in the next 12 months.
So why aren’t analysts more pessimistic?
“One obvious reason is that the hard data have given them no concrete reason to be. Retail sales have mostly continued to grow or at worst stagnate on a nominal basis, and unemployment remains extremely low.”2 Meanwhile, it is likely third-quarter earnings will confirm the strength of the economy.
Consumers are clearly fed up with inflation, but they keep spending. Cash reserves that were accumulated during the pandemic have depleted, however, and it is thought many have sustained their lifestyles by turning to credit. That can’t continue forever, though the end to spending will look less like a crash than a gradual deterioration.
“At the current rate, the economy could continue to send mixed signals until well into 2023. Bloomberg Economics, which forecasts a recession, isn’t expecting it to start until the third quarter of next year.”2
So, here we are: Act I of the bear market could conceivably be ending, provided implied inflation declines under 2.5%. But the catalysts aren’t there to cue Act II.
It is fertile ground for short-term rallies, and “that’s exactly what US markets have experienced, starting with the otherwise inexplicable 2.6% surge in the S&P 500 Index last week on a day when the Bureau of Labor Statistics reported that core inflation had reached a four-decade high”2 or the recent recovery in the face of rising yields.
Researchers and strategists at Morgan Stanley and DataTrek said this week that a bear market rally was possible, even likely, but interest rates need to decline, i.e., implied inflation.
Meanwhile, growth and consumer activity are nonstarters for a future bull market. In the near term, the fate of stocks remains wholly in the hands of monetary policy and the bond market. “Whether or not Act II of the bear market ever materializes, the intermission itself could be almost as dramatic as the play.”2
1 The Squeeze That Has the US Treasury Thinking About Buying Back Bonds, Bloomberg, 10/21/2022
2 ICE Inflation Expectation Index
3 Bonds Will Determine Where Bear Market in Stocks Goes Next, Bloomberg, 10/21/2022
Let IDC provide you the value and financial history of your favorite bank stock. For you to better understand our process of valuation, we offer a free, one-time analysis of one of the 202 banks in our bank analysis database. Simply send your request with the bank stock symbol to info@idcfp.com.
To inquire about IDC’s valuation products and services, please contact jer@idcfp.com or info@idcfp.com or call 262-844-8357.
John E Rickmeier, CFA
President
Robin Rickmeier
Marketing Director