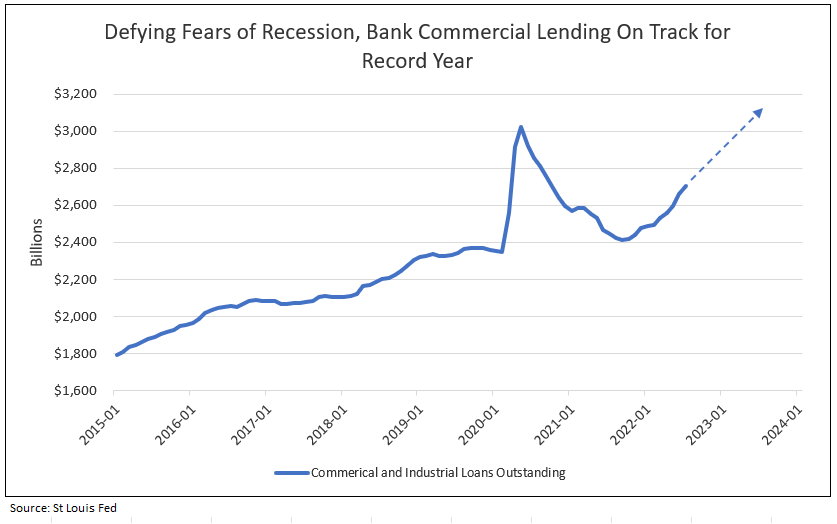
Defying Recession Fears, Bank Commercial Lending Accelerates
Favorable Lending Rates Creating a New Bull Market in Bank Stocks
The banking industry is healthy with strong capital positions, little loan delinquency, accelerating growth in commercialized lending, and favorable lending rates. IDC Financial Publishing (IDCFP) forecasts core PCE inflation, or sticky core CPI, to moderate to 3% in 2023, after headlining month-to-month CPI increases remain under 2.5% annualized for the remainder of 2022. As real wages expand so does the real economy and the Fed realizes a soft landing.
Chart I
Why the Fed might be at ‘neutral’ on monetary policy: A strong dollar and the unwinding of quantitative easing are equivalent to a 1% rise in the fed funds rate1.
Following are some key takeaways from the article from Financial Times, featuring Ed Yardeni, President of Yardeni Research1.
- Chairman Powell of the U.S. Federal Reserve indicated the funds rate is now “neutral” at his July 27 press conference, after raising the rate 0.75 basis points twice to the range of 2.25 to 2.50.
- Powell’s suggestion that the Fed is on the borderline of restrictive territory, and therefore closer to being done tightening, was well received by the bond and stock markets, but not the Fed’s critics or stock market bears.
- In fact, there is a conceivable way that Powell might be right after all.
- The European Central Bank and the Bank of Japan offer rates still at or near zero. As a result, the value of the U.S. dollar advanced 10% this year. In Ed Yardeni’s opinion, this is equivalent to at least a 50-basis point rise in the federal funds rate.
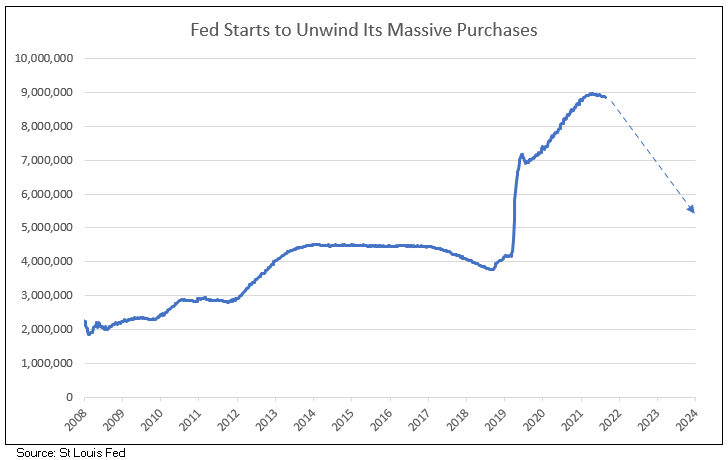
- In addition, the Fed has just started its quantitative tightening program (QT) to unwind its massive asset purchases of recent years (see Chart II). Starting in September, QT or the runoff, will be set at $60 billion for Treasury holdings and $35 billion for agency debt and MBS. That’s $95 billion a month, or around $1.14 trillion through August 2023. In Yardeni’s opinion, QT is equivalent to at least a 50-basis point rise in the federal funds rate.
- Together the strong dollar and QT add an equivalent of a 100-basis point increase, or 1%, to the federal funds rate. The Fed undoubtedly has some estimates from in-house models on equivalent rate rises represented by the strong dollar and QT.
Chart II
Long-Term Implied Inflation – Not Too Hot and Not Too Cold
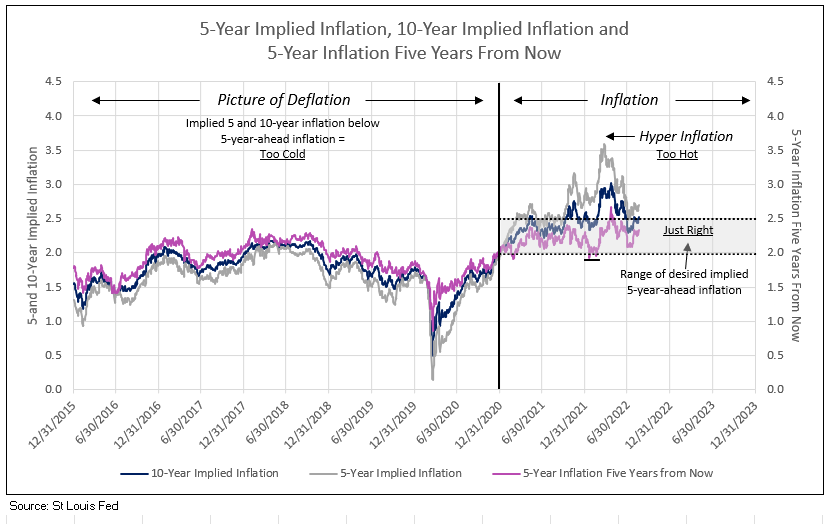
Five-year implied inflation five years ahead equals 10-year implied inflation less 5-year implied inflation. The difference provides expected inflation for a period of 5 years, starting 5 years in the future.
For example:
10-year implied inflation = 2.52
5-year implied inflation = 2.70
The difference is -0.18.
5-year implied inflation 5 years from now is calculated by adding 2.52 and -0.18 = 2.34
From 2015 through 2020, both the 5 and 10-year implied inflation were constantly below the 5-year-ahead implied inflation– a picture of deflation. The Federal Reserve’s objective was to create a picture of moderate inflation in the bond market post-Covid, where the 5 and 10-year-ahead implied inflation rose and remained above the 5-year-ahead rate, but all measures of implied inflation remained below 3.0% and above 2% (see Chart III).
However, in late 2021 and the first half of 2022, hyperinflation, which was followed by rapid increases in the federal funds rate with two 75-basis point hikes, lifted 5 and 10-year and 5-year-ahead implied inflation above 2.5%. As long as 5 and 10-year implied inflation remains under 3.0%, and 5-year-ahead is less than 2.5%, the Fed’s objective is met, achieving an inflationary environment that is not too hot or too cold.
Chart III
The Remarkable Correlation of Bank Stocks to 5-Year Implied Inflation 5-Years from Now
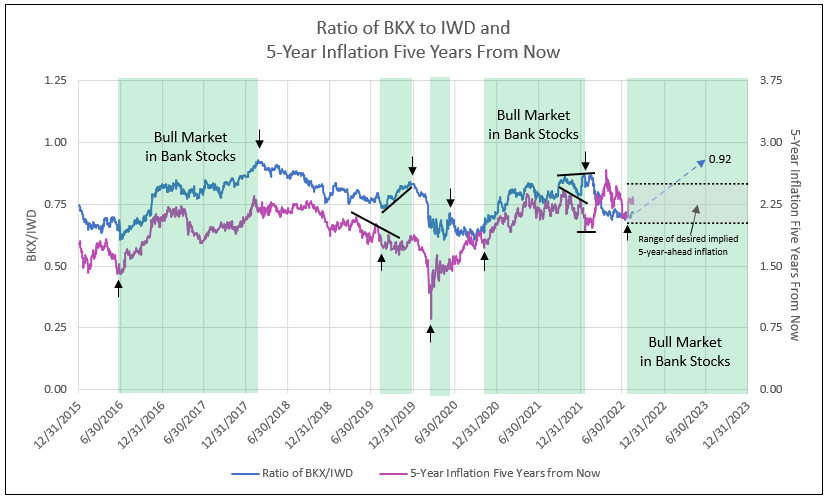
From 2015 to 2020, 5 and 10-year implied inflation was less than 5-year-ahead implied inflation, a trend of deflation. During this period, bank stocks performed when 5-year-ahead inflation was rising, as occurred from June 2016 to February 2018, August 2019 to January 2020, and March 2020 to May 2020. From September 2020 to September 2021, bank stocks benefited from inflation as implied 5 and 10-year inflation exceeded the 5-year-ahead. Bank stocks declined in the “bear market” in the first half of 2022, as implied inflation rose to hyper levels (see Charts III and IV).
A new bull market in bank stocks began in July 2022 with the low in 5-year-ahead implied inflation 5 years from now and will continue as long as this forward inflation level remains above 2.0% and less than 2.5%, while 5 and 10-year implied inflation remains less than 3.0%.
Chart IV
Oversold Bear Market Provides Opportunity for Bank Stocks to Outperform in 2022 Through 2024
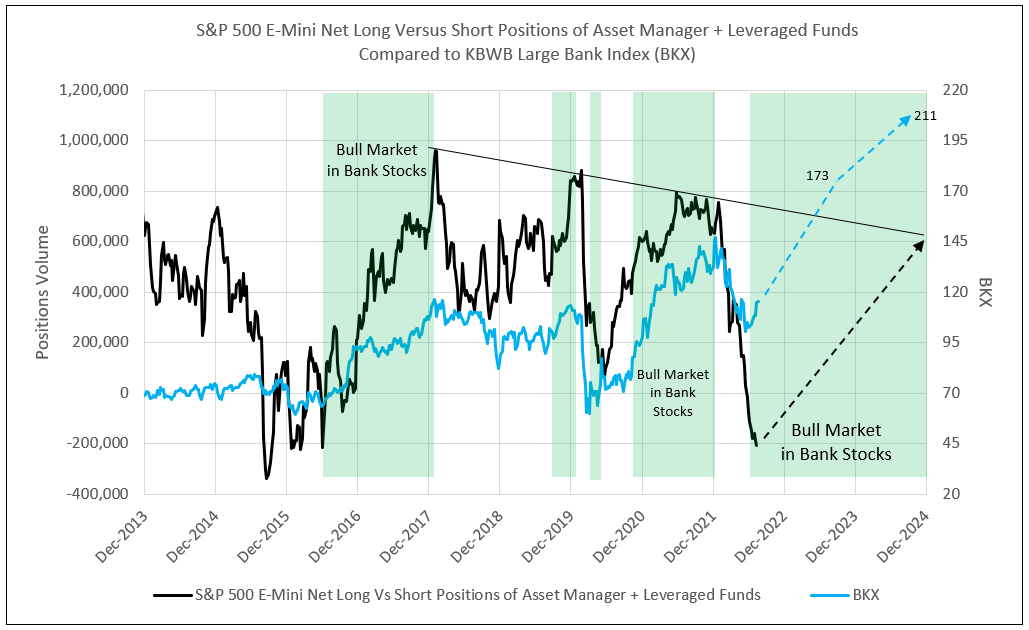
Historically, we have witnessed oversold conditions in bear markets with short exceeding long positions in the S&P 500 E-Mini Index at major negative cycle lows. In June 2016 and July 2022, these net short positions provided a major opportunity to buy into a bank stock bull market. Minor cycle lows with net long positions in August 2019 and September 2020 also triggered a bull market in bank stocks (see Chart V).
During these bull market periods, bank stocks outperformed value stocks as seen in the ratio of BKX to IWD (see Chart IV). Favorable fundamentals for banks, which include commercial loan growth, strong capital positions, low loan delinquency and rising lending rates, coupled with a controlled inflationary environment (not too hot and not too cold), provide superior bank stock performance (see Chart V).
Chart V
1 - Financial Times, August 14, 2022
Let IDC provide you the value and financial history of your favorite bank stock. For you to better understand our process of valuation, we offer a free, one-time analysis of one of the 202 banks in our bank analysis database. Simply send your request with the bank stock symbol to info@idcfp.com.
To inquire about IDC’s valuation products and services, please contact jer@idcfp.com or info@idcfp.com or call 262-844-8357.
John E Rickmeier, CFA
President
jer@idcfp.com
Robin Rickmeier
Marketing Director
