Forecasts of Cycle Low in Stock Market
A number of approaches forecast a cycle low in the “bear” stock market in July 2022. The data in the bull camp are as follows: a third big week in five for small caps, signs exchange-traded fund buyers have become healthily demoralized, and measures of market breadth expanding in ways that have signaled further gains in the past.”1
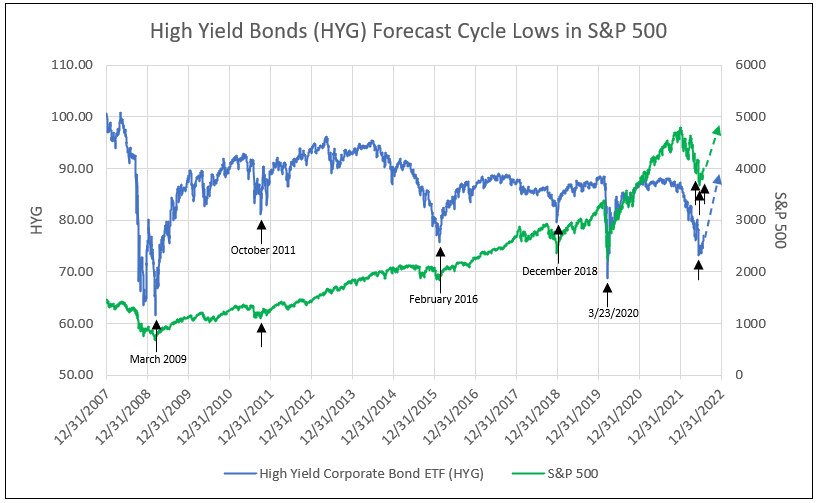
The cycle lows in the High Yield Corporate Bond ETF (HYG) has historically called the low in a stock market downturn, as indicated in March 2019, October 2011, February 2016, December 2018, March 2020 and May, June, and July 2022 (see Chart I)).
Chart I
A near-term illustration is the year-to-date decline in HYG in 2022 plotted with each the S&P 500 and KBW Large Bank ETF (KBWB). The first HYG cycle low was in May and replaced by a broad-based low in June and July 2022, with a spike low in the S&P 500 on June 16 (see Charts II and III).
Chart II
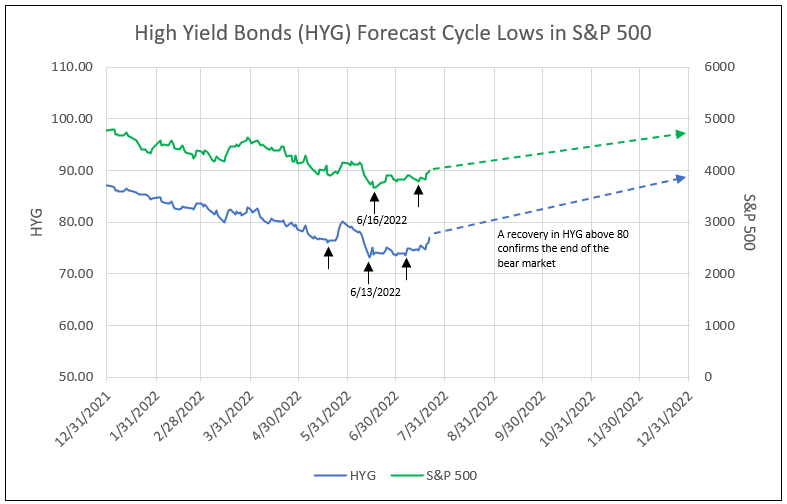
Chart III

Another approach to forecasting the cycle low in the S&P 500 is the significant decline in the Net % Taking Higher Than Normal Risk Levels (RHS) from the Bank of America July Survey of Global Investment Managers. The record level in the cycle low in RHS of a negative 58% in July 2022 surpassed the low in October 2008 during the financial crisis (see Chart IV).2
Chart IV
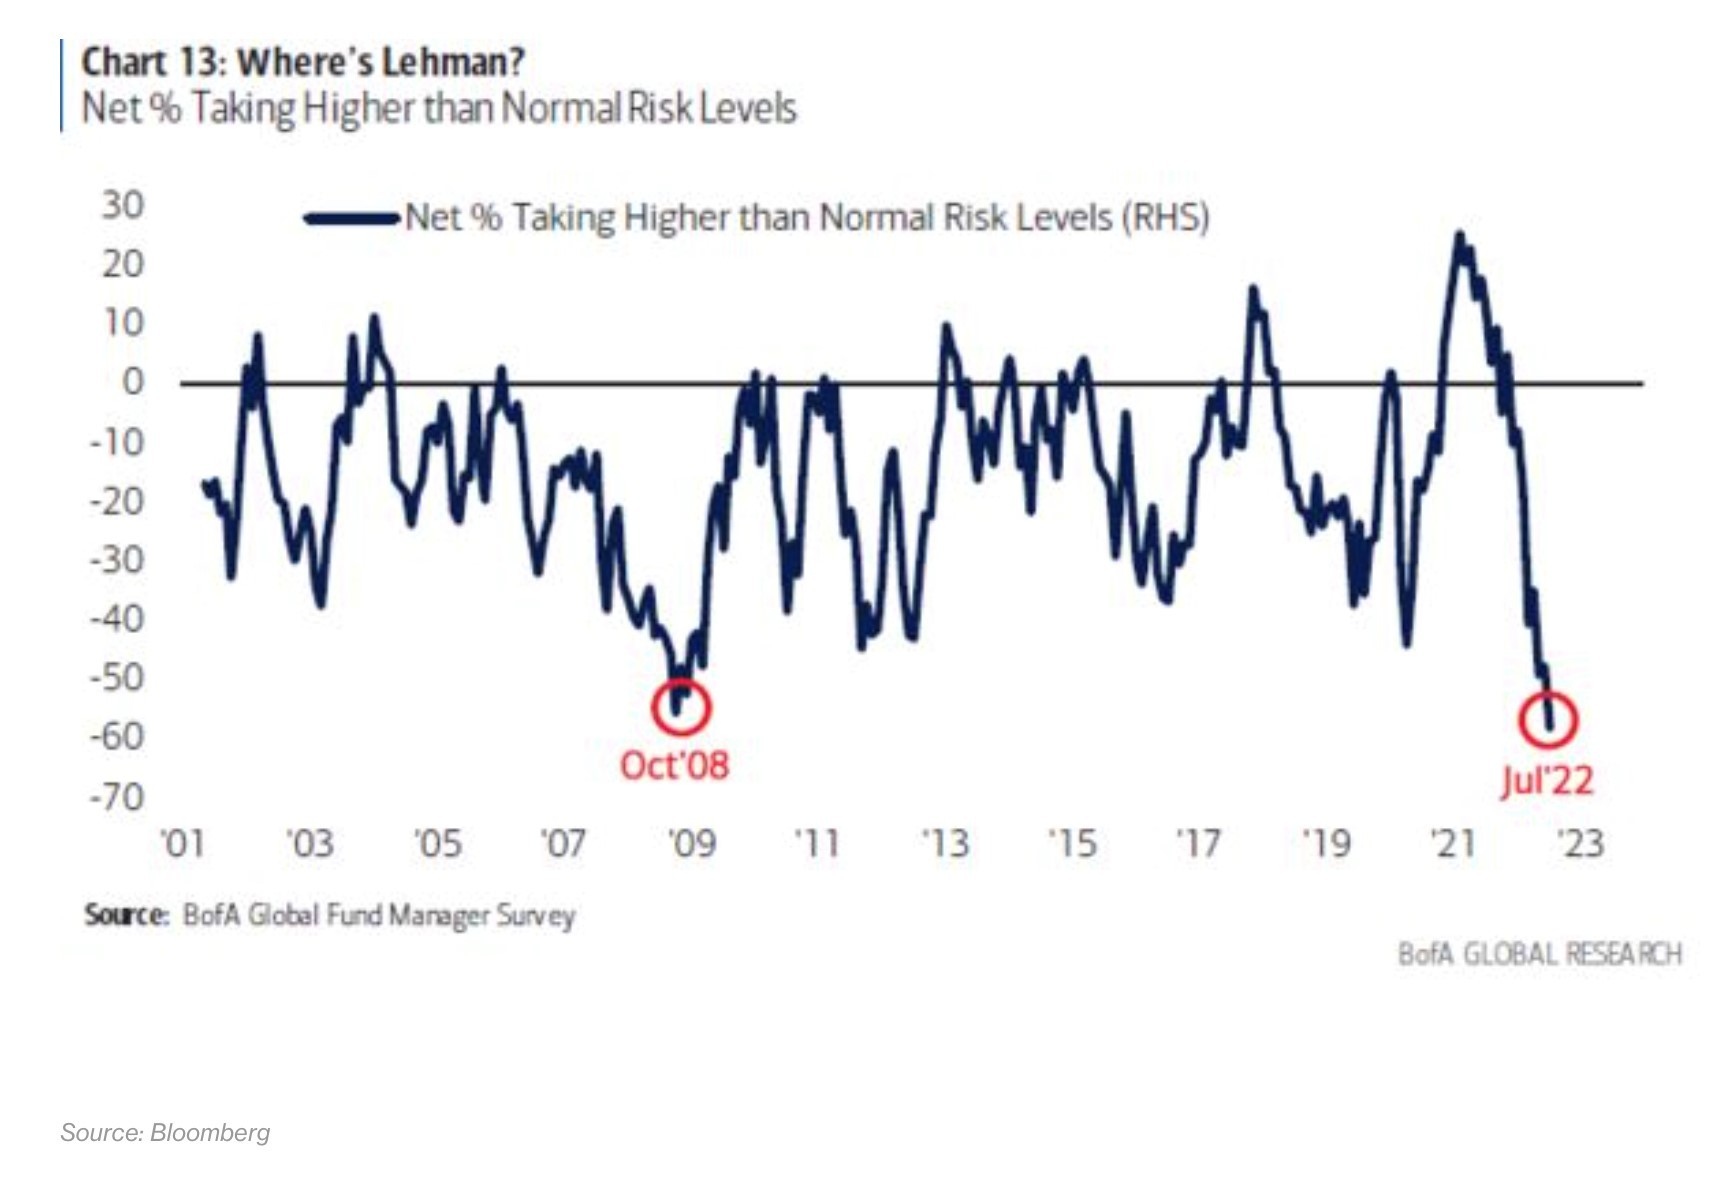
Source: Bloomberg
To back up the risk analysis, Bank of America, commenting on the survey of Net % Saying Recession, indicated it likely reached a peak level above 50% in July 2022, compared to its highs of near 90% in March 2009 and April 2020, both peaks following bear market cycle lows (see Chart V).2 The fear of recession accelerated from May forward, resulting in the recent down leg in equities to the June 16 low, with almost all stock groups declining.
In particular, fear of recession caused a downdraft in bank stocks from May to June, as analysts adjusted the EPS outlook for potential increases in loan losses. Banks, reporting earnings for the second quarter 2022, increased the loan loss provisions as required by CELA (estimating loss at the time of loan origination).
Chart V
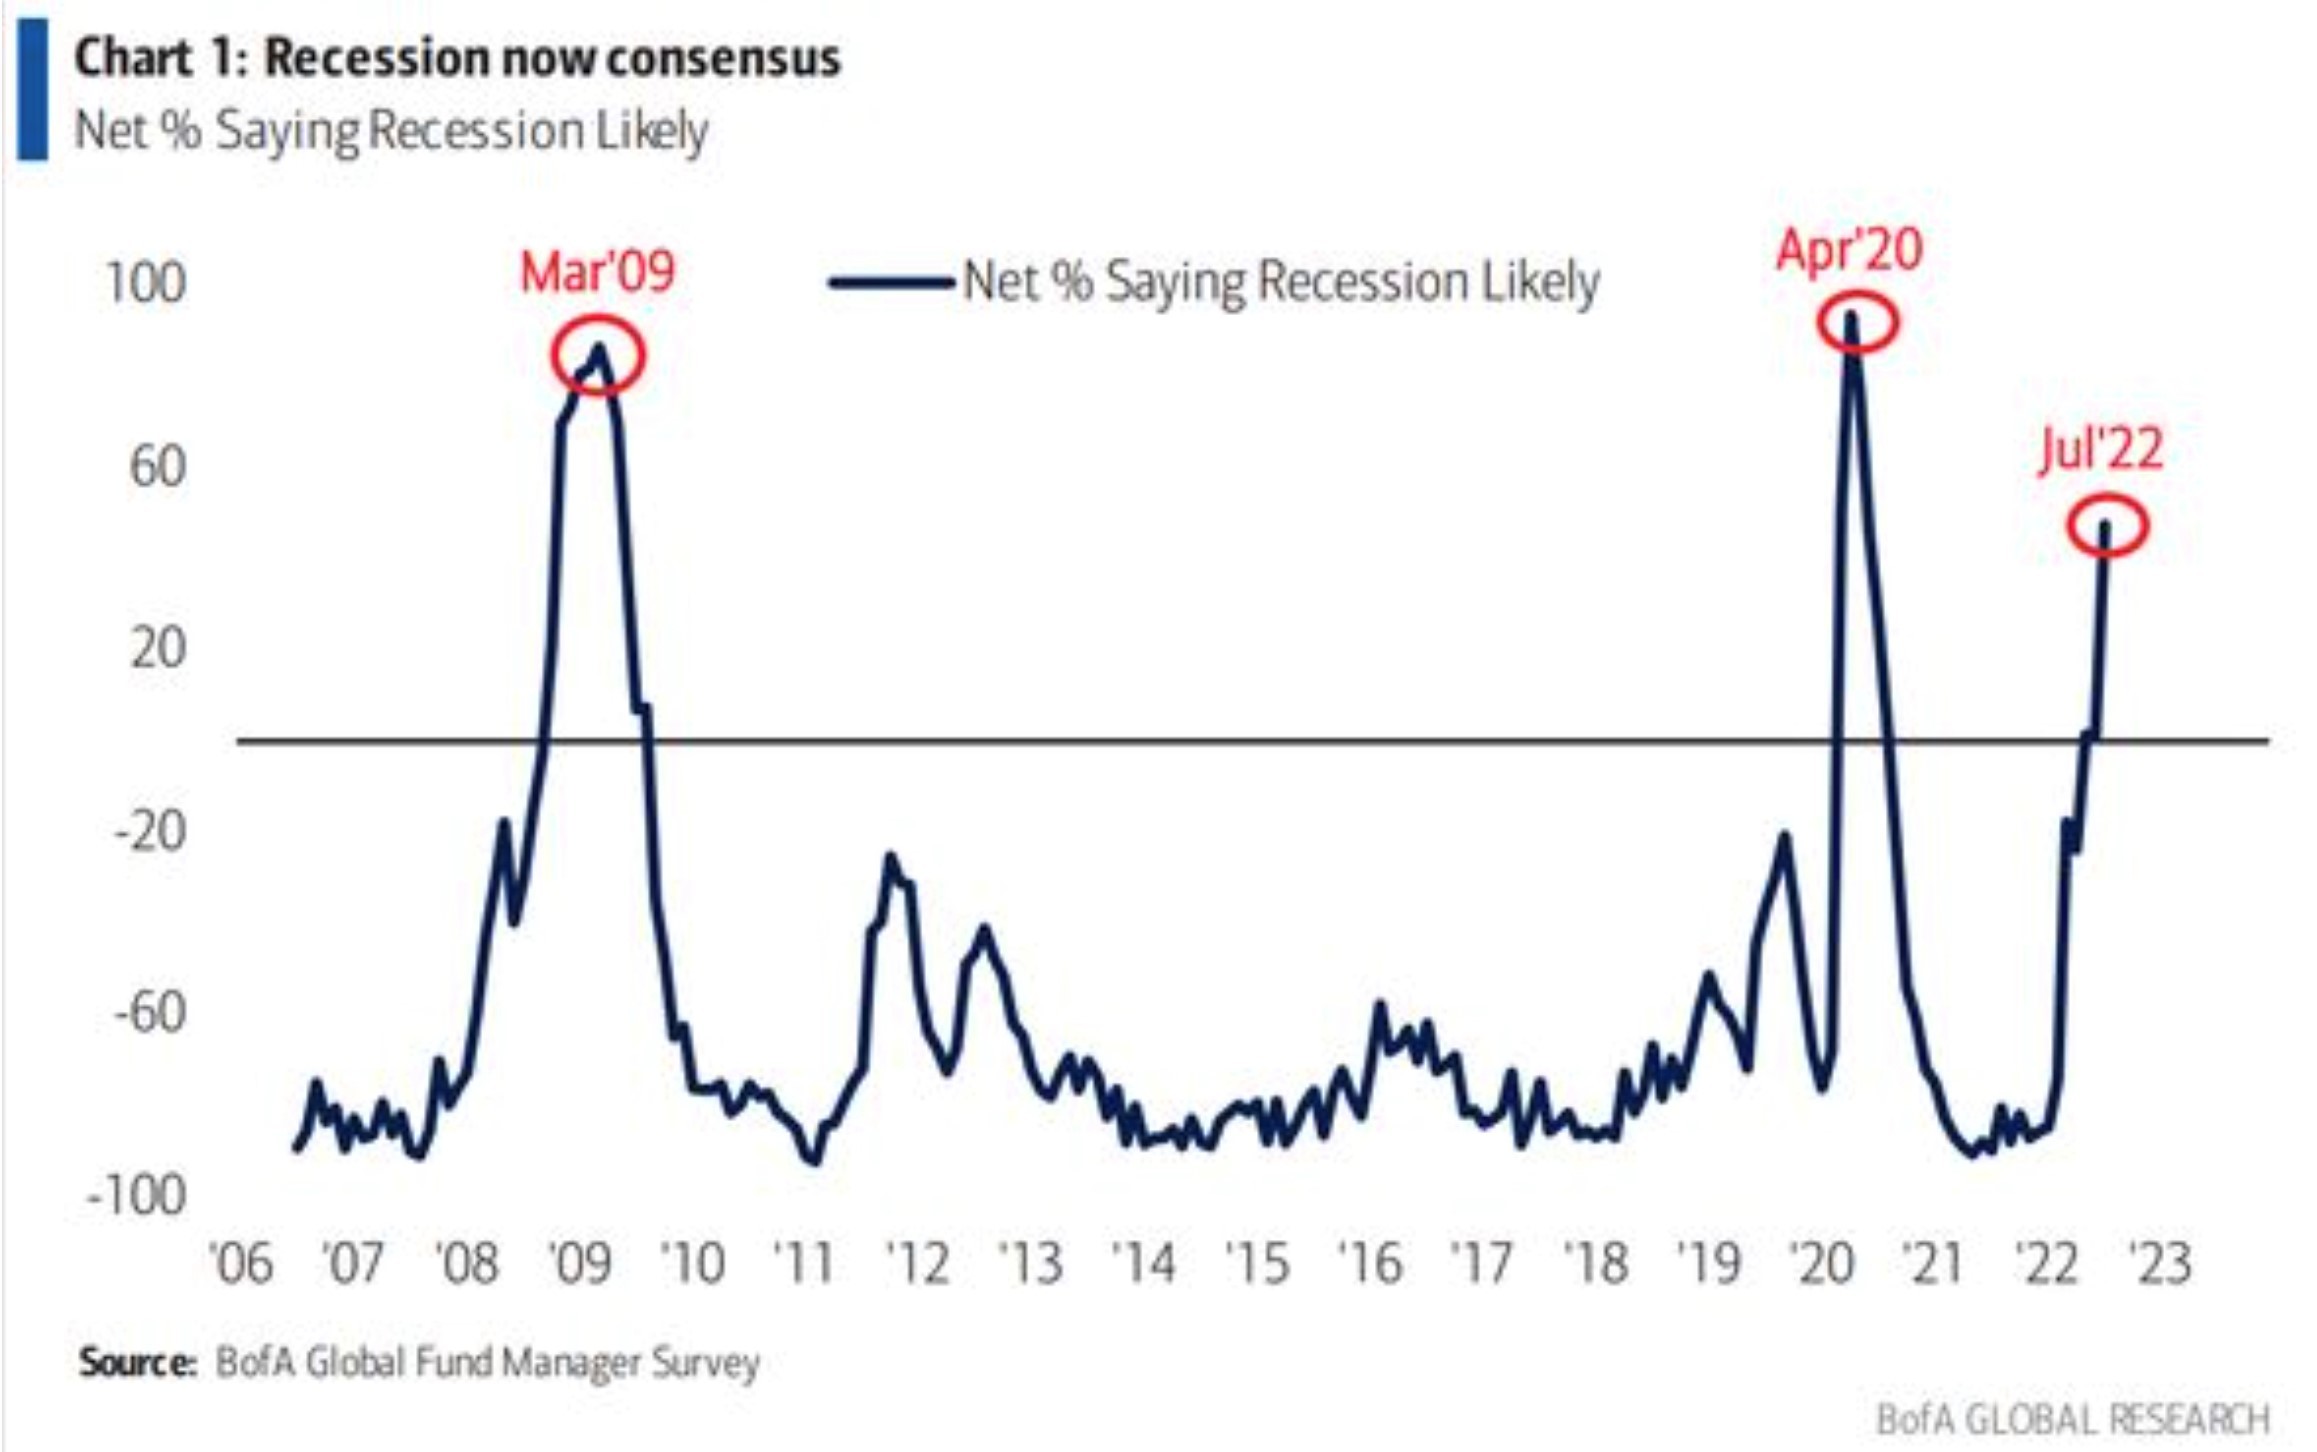
Source: Bloomberg
Another Unique Approach
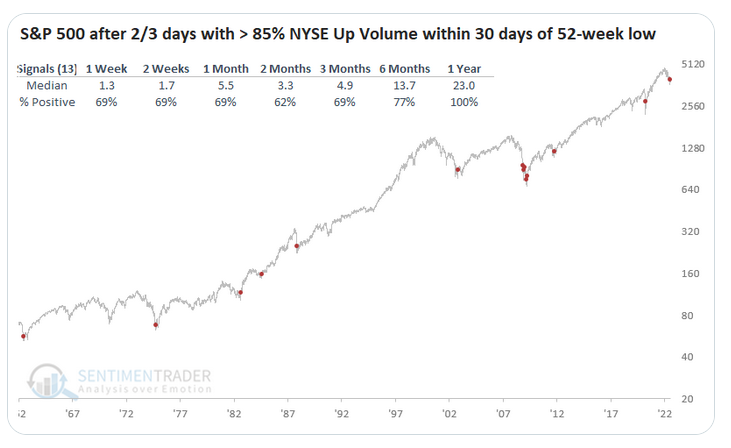
The S&P 500 has a perfect track record of triggering a signal to call the end of a bear market. Per Jason Goepfert, Chief Research Officer and founder of Sentimen Trader, when advancing volume on the NYSE is 87% of total trading for two out of three days following a 52-week market low, the S&P has never been negative a year later.3
Note, in 2008/2009, during the Lehman financial crisis, this indicator registered multiple buy points (red dots on Chart VI) at stock market lows.3
No forecast is perfect, and no one can accurately forecast the future, but high probabilities can provide confidence in a forecast. This is illustrated by the % positive number for 1 week to 1 year in Chart VI.
Chart VI
Source: Jason Goepfert on Twitter
Another source of technical forecasts provides a similar conclusion indicated, as “Tuesday marked the second session in three that the market volume on rising stocks topped falling ones by a ratio of at least 10-to-1.”1
The phenomenon “double breadth thrusts” as described by Ned David Research, tend to herald outsized gains. The S&P 500 has risen more than twice its historic pace following such signals since 1950, jumping 10% six months later.1
“The double 10:1 up day supports the argument that the second-half rally is underway,” said Ed Clissold, chief US strategist at Ned Davis who forecasts the S&P 500 to end the year at 4,400, about 11% higher than it is now. “How sustainable the rally is will likely depend on monetary policy and earnings, but technical indicators will likely provide the information before Fed officials or management teams.”1
Bank Earnings
Given the recession is minor or no recession occurs, S&P 500 EPS forecasts hold up. As an example, reported EPS for S&P 500 financials were 3.1% above street estimates as of July 22 with 45% financials reporting. The surprise occurred despite CELA requiring banks to recognize potential loan losses at the inception of a loan.
Assuming the peak rate of inflation expectation, banks are taking large provisions for loan loss. J.P. Morgan reported a 28% decline in profit from a year ago in the second quarter. However, the JPM report of ROTCE, or core return on tangible equity before provisions for loan loss, was higher in June than in March 2022.
IDCFP’s estimate of NOPAT ROE, net operating return after-tax on tangible equity capital (which adds to net income the increase in the loan loss reserve to capture cash flow), declined in the second quarter 2022.
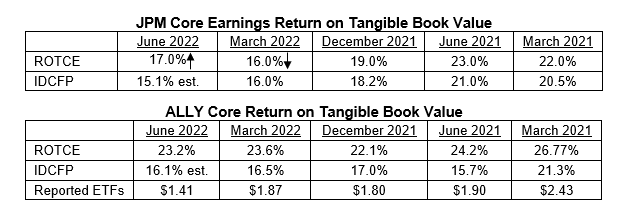
Every bank seems to tailor the reported ROTCE to meet their standard for forecasting the future. JPM eliminated provisions, while ALLY did not. IDCFP allows for deduction of loan loss provisions, but adds back any quarterly increase in the loan loss reserve to correct for cash flow. While ALLY stock price fell reflecting the announcement of lower EPS, the ROTCE remained firm at high levels. IDCFP relies on its 2023 forecast of NOPAT ROE to estimate the value of a bank.
Bank Stock and Market Outlook
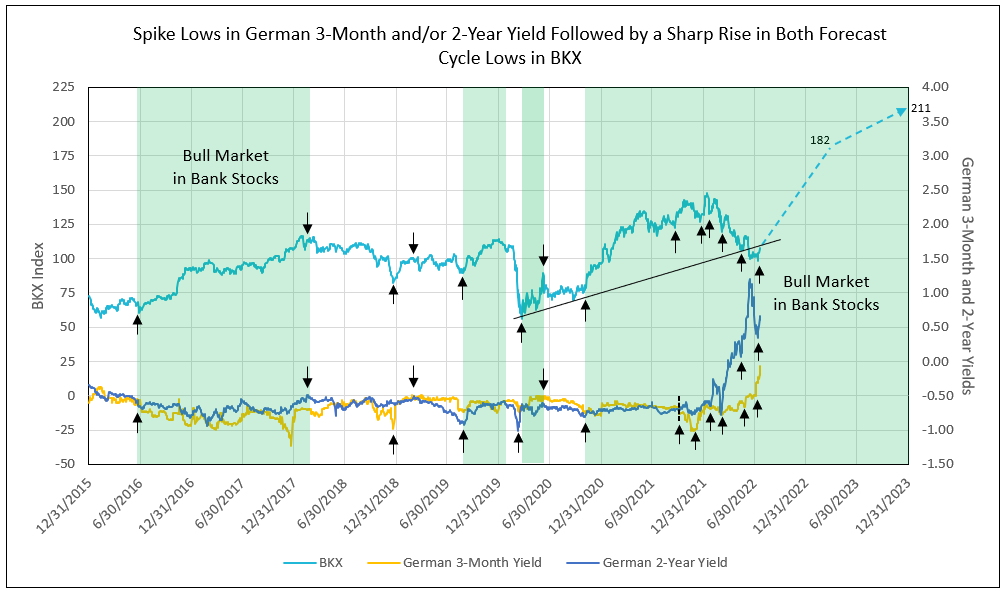
The EU and Germany are returning to positive interest rates, setting the stage for a bull market in banks stocks (see Chart VII). In comparison, from early 2018 to June 2019, German yields turned more negative in response to Trump tariffs.
Chart VII
Articles like “How China Could Trigger the Next Sharp Selloff in Crude,” to technicals at Fundstrat forecasting a $80 crude oil price later in 2022, to Citi’s Ed Morse forecasting a price of $80 a barrel, or $65 in a mild recession, all reduce energy inflation expectations.
Declines in food commodities forecast a drop in food prices. Futures markets and swap spreads indicate CPI month-to-month inflation under 2.4% a month annual rate in the last 4 months of 2022. Housing is collapsing, but rents still hold firm, resulting in 30% of CPI remaining above average over a longer period.
As happened with the last three recovery attempts, economically sensitive stocks such as automakers, banks, retailers, and chipmakers have led the way this time around.
Small-cap stocks were a notable strong performer, and while the Russell 2000 trailed the market previously, it’s now edging ahead. “Since 1978, small-caps have always outperformed coming out of bear markets, according to Sam Stovall, chief investment strategist at investment research firm CFRA.”1
“Earnings sentiment is souring during this reporting season. After holding on to their rosy outlooks while stocks fell into a bear market in the first half, analysts are now rushing to revise numbers. Forecast earnings for 2023 have fallen five straight weeks, though not by a lot. They’re down 2% to $244 a share, data compiled by Bloomberg Intelligence show.”1 The forecast from Ed Yardeni is $235 for the S&P 500 in 2023 (see Chart VIII).
The reset in earnings expectations is good because it suggests a capitulation that JPMorgan strategists say may prompt investors to seek an inflection point in the market.1
The question remains, after the 75-basis point hike in the Federal funds rate in July, will the Fed moderate its tone to reflect slower inflation in September and beyond. The latter certainly would cause a major reversal in equity prices.
Chart VIII
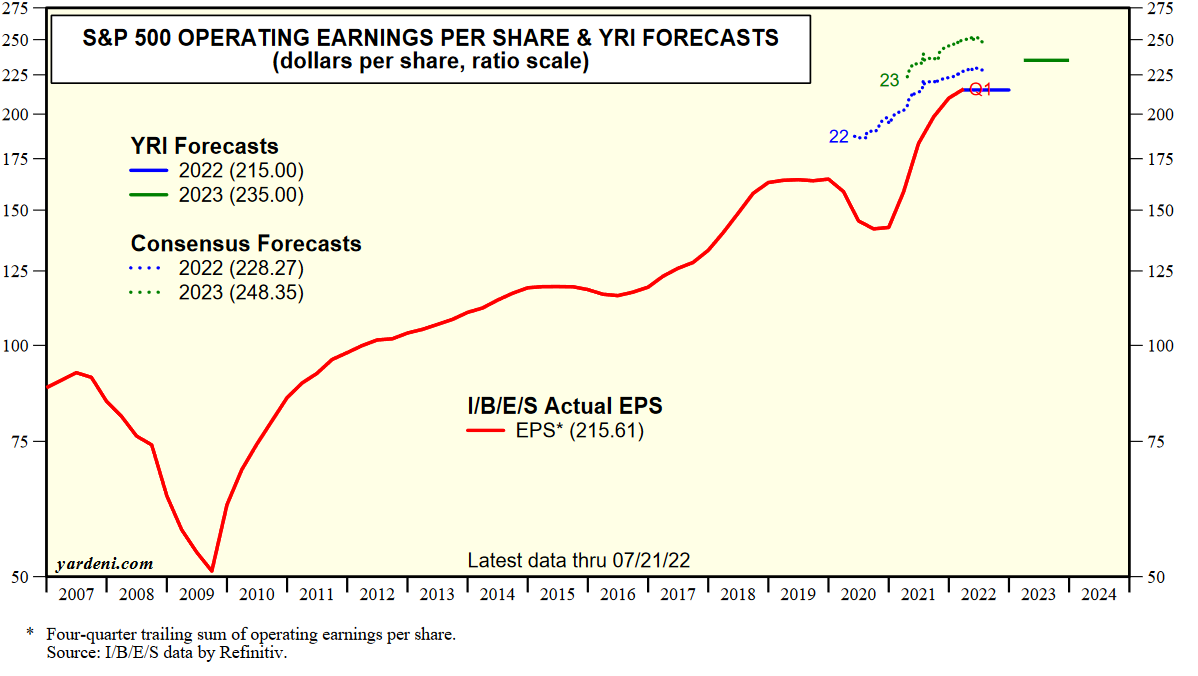
Source: Yardeni Research4
1 - Broken Bulls, Bog Breadth: Weighing a Case for a Turn in Stocks, Bloomberg
2 - BofA Survey Shows Full Investor Capitulation Amid Pessimism, Bloomberg
3 - S&P 500 triggers signal with perfect track record for calling end of bar markets, CNBC 4 - http://www.yardeni.com
Let IDC provide you the value and financial history of your favorite bank stock. For you to better understand our process of valuation, we offer a free, one-time analysis of one of the 202 banks in our bank analysis database. Simply send your request with the bank stock symbol to info@idcfp.com.
To inquire about IDC’s valuation products and services, please contact jer@idcfp.com or info@idcfp.com or call 262-844-8357.
John E Rickmeier, CFA
President
jer@idcfp.com
Robin Rickmeier
Marketing Director