Inflation Measured by Dallas Fed’s Trimmed Mean Core PCE Peaks in November 2021
Cycle low in U.S. T-Note yields due to several reasons. First, a massive short position, which anticipated significant yield increases, was covered to limit losses. The second reason remains foreign buying of U.S. Treasuries since dollar hedge U.S. yields continue to exceed foreign government yields hedged for currency risk. Third, the Fed continues to purchase each month a significant position of U.S. Treasury securities. Near-term, 10-year yields could approach 1.5%.
When the 10-Year yield minus the core PCE inflation rate reaches its most negative point and reverses, this forecasts a low and recovery in the TIPS yield (see Chart I). Or, when the Federal Reserve changes policy and begins tapering, or announces potential to begin tapering, mortgage and bond purchases, this leads to the same outcome.
Chart I
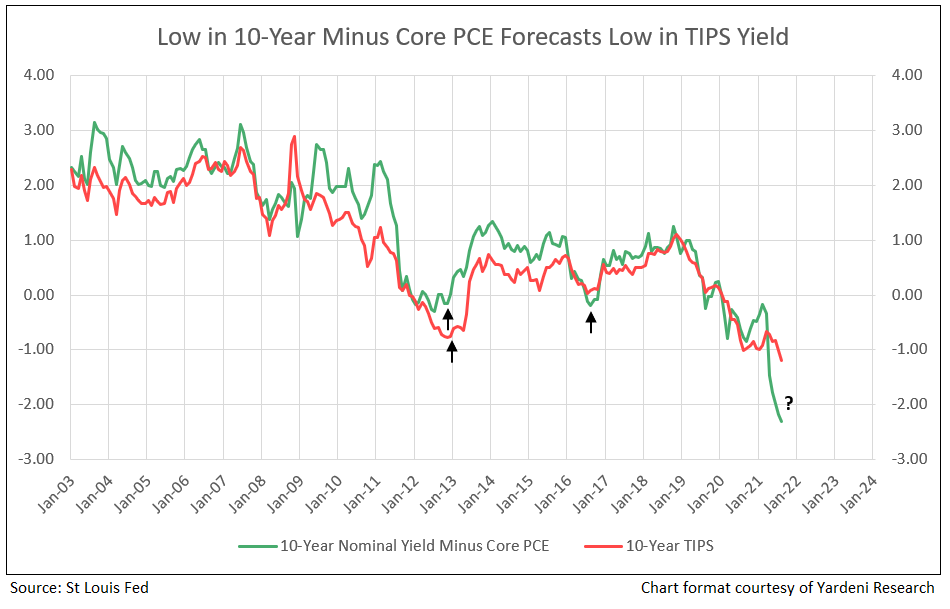
Low in the TIPS yield plus implied inflation determines the low in the nominal 10-year yield. In today’s environment, low nominal yields are due to a negative 1.2% TIPS yield.
However, by using the US 10-Year yield less the trimmed mean core PCE inflation rate (thereby eliminating the extreme highs and lows of the components) the low has already occurred, forecasting a sharp increase in the 10-year TIPS yield from -1.2% to -0.4% (see Chart II). Adding implied inflation of 2.4% forecasts the recovery in nominal 10-year from the current level of 1.3% to 2.0% by year end 2021.Bank stocks would be the major beneficiaries of the increase in nominal 10-year yields to 2%. Demark technical analysis of price movement indicates the low occurs in August 2021 (see Chart II and IV).
Chart II
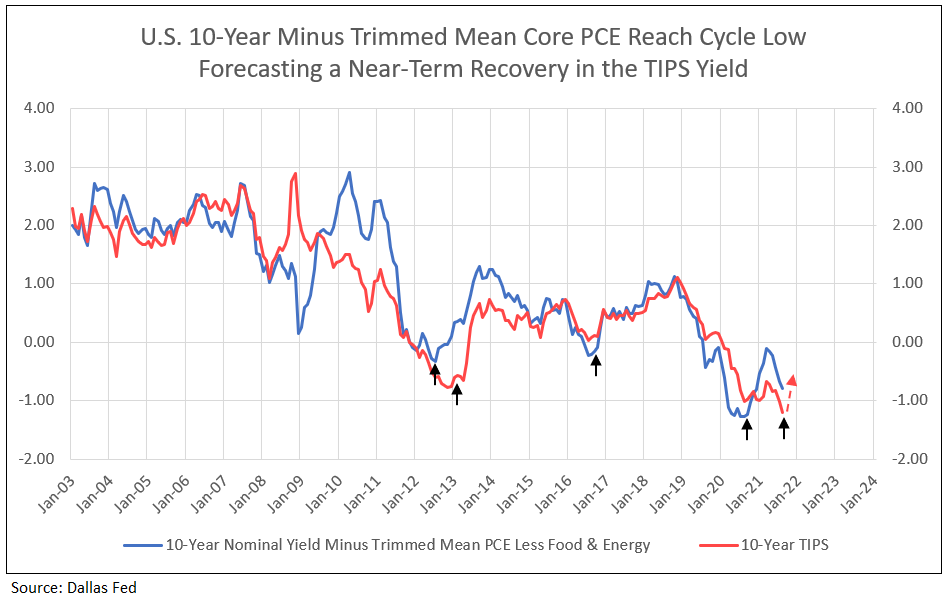
Chart III
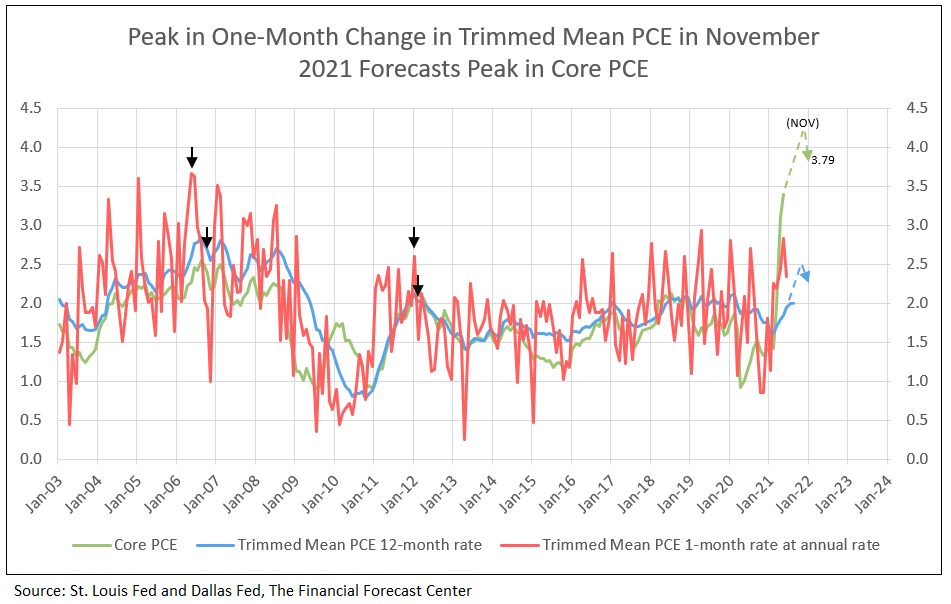
The Trimmed Mean PCE inflation rate is an alternative measure of core inflation in the price index for personal consumption expenditures (PCE). It is calculated by staff at the Dallas Fed, using data from the Bureau of Economic Analysis (BEA).1
Chart IV
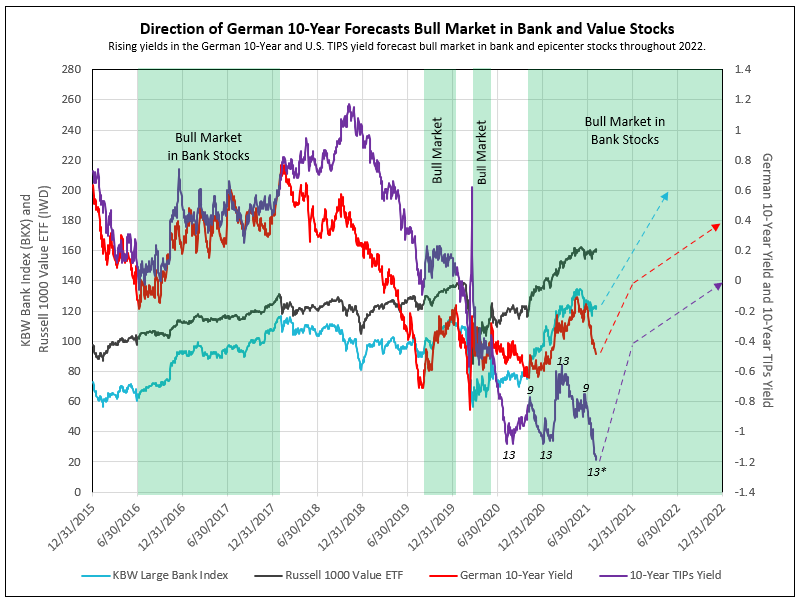
*DeMark indicators 13 and 9 are turning points on the weekly chart of LTPZ 15-year plus TIPS index ETF, translated to the 10-year TIPS yield.
The weekly index of LTPZ, 15-year U.S. TIPS index from PIMCO tracks the price of long-term TIPS prices. DeMark, on Symbolik app, uses a technical indicator to indicate potential buy and sell points. A weekly 13 or 9 signal indicates an exhaustion in a move in a bull or bear market for the stock or ETF monitored. LTPZ is currently on a 13 sell in price, and therefore a low in yield. The low in long-term yields is confirmed by the DeMark signals of a peak in TLT (price of 20-year T-Bonds) and a low in TNX (nominal yield on 10-year T-Note).
- “The Consumer Price Index (CPI) and the Personal Consumption Expenditures Deflator (PCE) jumped to their highest annual rates since 2008 in April and are likely to accelerate further in the near term. However, due to how shelter costs are measured, the housing components of the indices decelerated considerably over the past year, despite strong home price appreciation. This has kept topline inflation from being even higher.”2
- “Lagged effects from the past year's house price appreciation and more recent rent recovery could begin to flow into inflation measures as soon as the May readings. House price gains to date suggest an eventual acceleration in shelter inflation from the current rate of 2.0 percent annualized to about 4.5 percent. If house price growth continues at the current pace, shelter inflation would likely move even higher.” 2
- “Timing lags suggest increasing shelter inflation will last through at least 2022, meaning "transitory" increases to the rate of overall inflation may be more prolonged than many are expecting. Due to the heavy weight given to shelter, housing could contribute more than 2 percentage points to core CPI inflation by the end of 2022 and about 1 percentage point to the core PCE. Both would be the strongest contributions since 1990.” 2
According to Fannie Mae, the shelter component should add 0.7% by November 2021, rising to a 1.0% contribution to PCE at the end of 2022 – that is marginally a 0.3% addition in 2022.
We conclude the 1-month trimmed mean core PCE growth will peak in November 2021, with the 12-month change in trimmed mean core PCE peaking six months later in 2022 (see Chart II). The Federal Reserve opinion that the current bout with inflation is temporary is, in our opinion, correct.
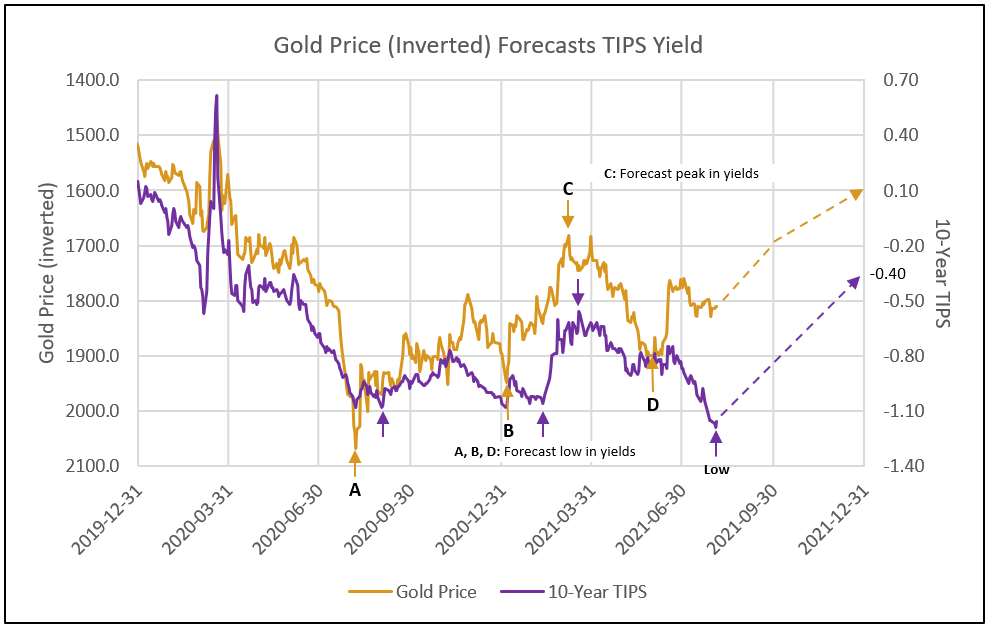
The Price of Gold Forecast of the 10-Year TIPS Yield
Declines in the price of gold from peaks in 2020 and January and June of 2021 (shown inverted on the chart below) forecast lows in TIPS yield. See IDCFP’s article that discusses this relationship in more detail.
Chart V
1: The Federal Reserve Bank of Dallas
2: Fannie Mae, Housing Insights: Housing Poised to Become Strong Driver of Inflation, June 9, 2021.
To view all our products and services please visit our website www.idcfp.com.
For more information about our ranks, or for a copy of this article, please contact us at 800-525-5457 or info@idcfp.com.
John E Rickmeier, CFA
President
jer@idcfp.com
Robin Rickmeier
Marketing Director
