Bank Stock ROE vs. COE Forecasts a 50% Appreciation Potential in 2021
IDC Financial Publishing (IDCFP) measures relative profitability of bank holding companies by comparing the IDCFP real return on tangible equity (NOPAT ROE) to our definition of the cost of equity (COE). Margin between ROE and COE (included in the “M” in IDCFP’s unique CAMEL analysis) is a key measure of management.
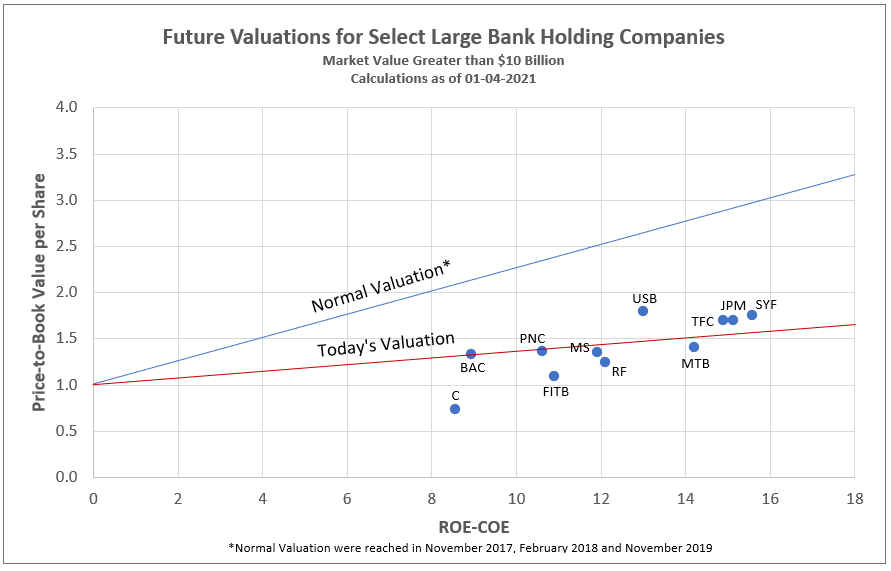
If the spread of ROE less COE is positive, or improving, management is creating value. The wider the spread, the greater the value. If the spread of ROE less COE is decreasing, or negative, management is destroying value. Bank value is, in turn, then determined by comparing its stock price to its tangible book value per share versus the spread between ROE and COE, to determine a bank stock’s valuation (see Chart I).
The projected long bond U.S. Treasury yield for January 2022 was 2.25% and the forecast COE average for select large bank holding companies was 4.7%, with COE ranging from 3.56% for Synchrony Financial (SYF) to 5.65% for Bank of America Corporation (BAC). As seen in Chart I, there is a high correlation between price-to-book value per share compared to IDCFP’s spread of ROE less COE for large bank holding companies. This correlation demonstrates how COE, when defined by long-term U.S. Treasury yields and bank-specific risk, best determines cost of equity capital, in comparison to NOPAT ROE, and therefore the value correlation or valuation line.
Chart I
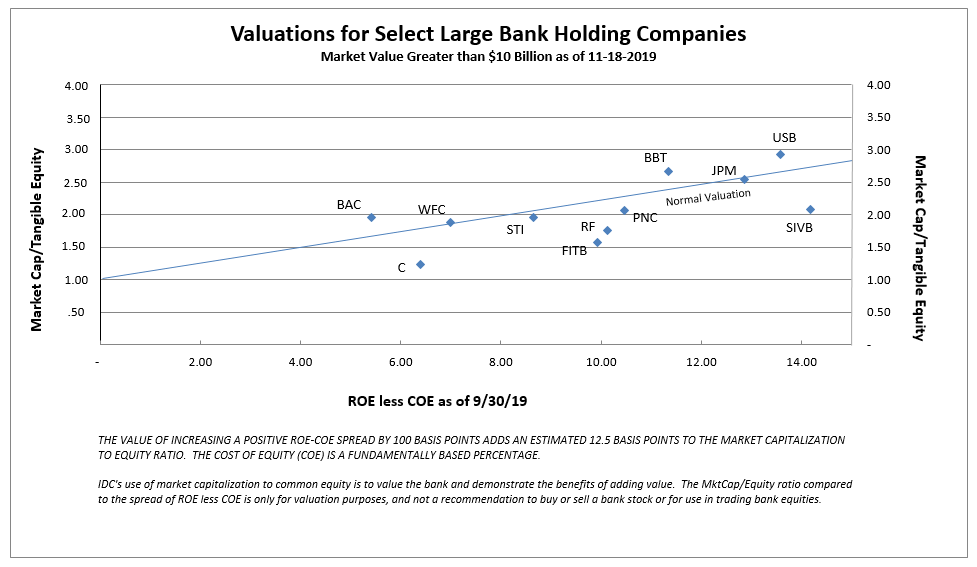
Favorable Large Bank Valuations on November 18th, 2019
To understand the normal valuation line from Chart I, Chart II shows the ROE from September 20th, 2019 and market valuation as of November 18th, 2019. Following the August 2019 low in bank stocks, we witnessed superior bank stock performance that led to the stock market recovery from August to November 2019. High quality, large bank stocks with spreads between ROE and COE of 14 percentage points sold as high as 2.90, and as low as 2.07 times tangible book value. Spreads of 8% sold at 2 times book value (see Chart II).
These normal valuations and favorable ROE less COE spreads reflected a strong and healthy economy in 2019, with an optimistic outlook for 2020 - - all pre-Covid-19. The normal valuation line in Chart I reflects a profitable banking system and economic recovery in 2021.
Chart II
How IDCFP Projects the 1-Year Outlook for a Bank
Our parameters of each bank include the following:
1) A long-term U.S. bond yield forecast of 2.25% for January 2022.
2) A cost of equity capital (COE) equal to the U.S. long bond yield, plus one-half of that yield times that bank’s specific risk level as of 9/30/2020.
3) A bank’s book value per share for 9/30/2021 equals the current book value increased by the one-year reinvestment rate of NOPAT ROE (after dividends), OR the previous year’s increase in book value per share, whichever is greater.
4) ROE equals the NOPAT ROE for the past year, defined as the net income plus the increase in the loan loss reserve divided by common stockholder’s equity plus the loan loss reserve.
Forecast Calculation
- The forecast of ROE less COE spread determines the horizontal axis
- The normal valuation line, previously realized in November 2017, February 2018 and November 2019, forecasts the price-to-book value ratio for each bank (see Chart I).
- Using the projected book value per share for September 2021, and forecast of price-to- book, we calculate forecasted price per share.
- Forecast price is compared to today’s price for an estimate of appreciation potential.
IDCFP calculates the price appreciation potential for 246 bank holding companies daily. Contact us for more information.
When and Why Bull Markets in Bank Stocks Occur
A great concern of bank stock investors is short periods of bank stock superior performance, As seen in Chart III, these periods ranged from 20 months (June 2016 to February 2018), to 4 months (August to November 2019), to 2 months (March to early June 2020).
While bank and value stocks perform in a similar cycle, banks stocks have outperformed value stocks during these bull market periods (see Chart III). More importantly, bank stocks rely on a widening yield curve to perform. A key to the U.S. yield curve widening has been the rise in the U.S. 10-year yield, however, the increase in the 10-year from February 2018 to November 2018 provided an incorrect signal. Therefore, we feel, alternatively, the German 10-year yield provides a better indicator of the yield spread and forecast for bank stocks performance.
The German 10-year yield encompasses the impacts of tariffs and the influence of those tariffs on the growth of Chinese, European and other Asian economies. Note, the bank stock bull market from June 2016 came to a halt in February 2018, as the German 10-year yield rose to its peak of +0.765% and reversed. The decline to its low of -0.71% in August of 2019 was primarily due to U.S. tariffs on China and the world, which reduced economic growth outside the U.S. Beginning in late August 2019, the relief from this cycle began, when another short-term bull market in bank stocks was created as the German 10-year yield rose from -0.71% and reached -0.26% in November 2019. The advent of Covid-19 in February 2020 reduced bank stocks to their low in March 2020. The next bull market in bank stocks occurred from March 23rd to June 6th, 2020, as the German 10-year recovered from its March low to its peak. The current bull market began in August 2020 with cycle lows in both the U.S. and German 10-year yields (see Charts III and IV).
Chart III
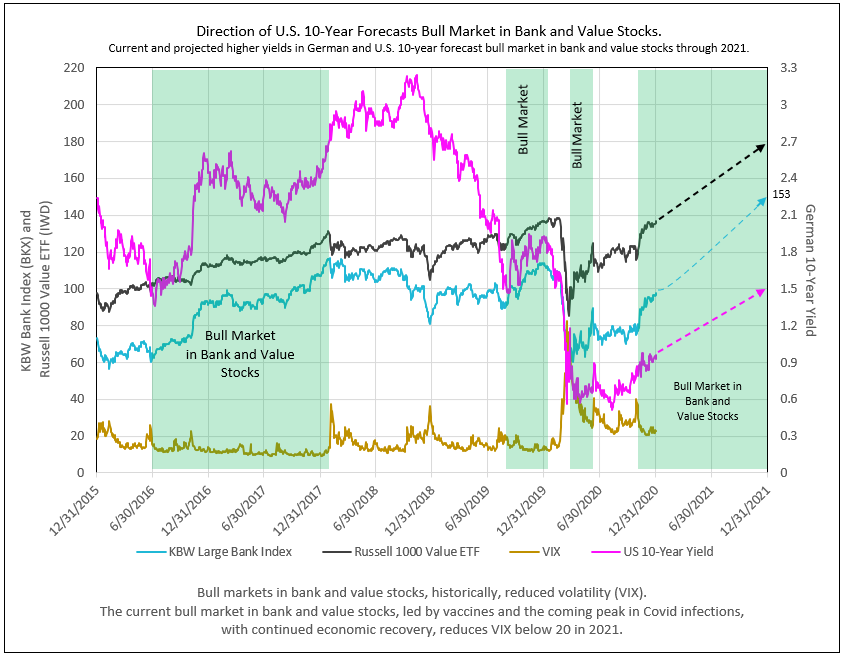
Chart IV
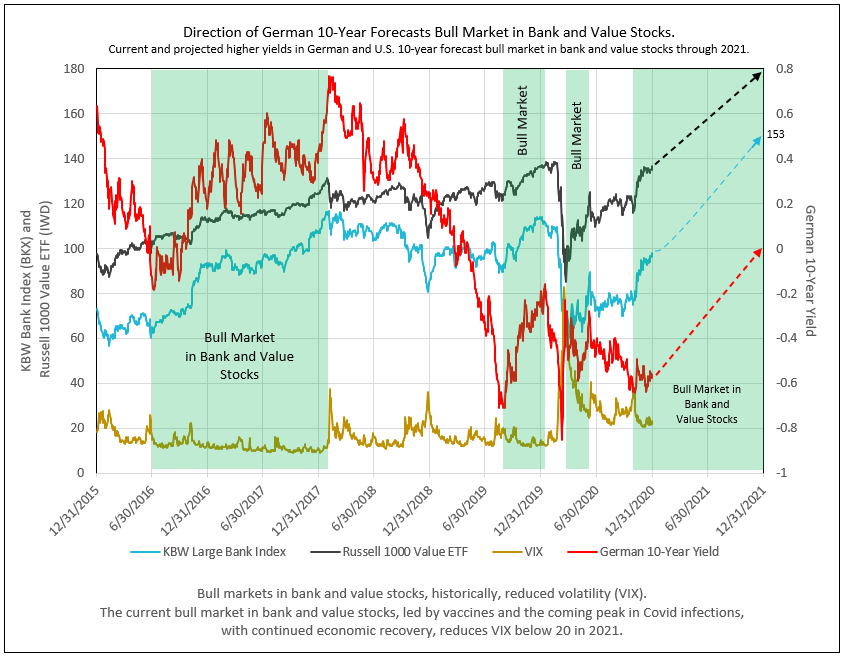
The surprise in 2021 could well be the rapid rise in the German 10-year yield from current levels of -0.57% to zero and even +0.3%, following a peak in Covid-19 in Germany and widespread vaccines in Europe. Led by import prices, Germany and Europe will see a strong recovery in inflation and, therefore, positive German yields. Combined with an improved U.S. economy and strong U.S. inflation, together, forecasts a significant rise in the U.S. 10-year yield to 1.5% in 2021.
To view all our products and services please visit our website www.idcfp.com.
For more information about our ranks, or for a copy of this article, please contact us at 800-525-5457 or info@idcfp.com.
John E Rickmeier, CFA, President, jer@idcfp.com
Robin Rickmeier, Marketing Director