Dynamics of the Brokered CD Market
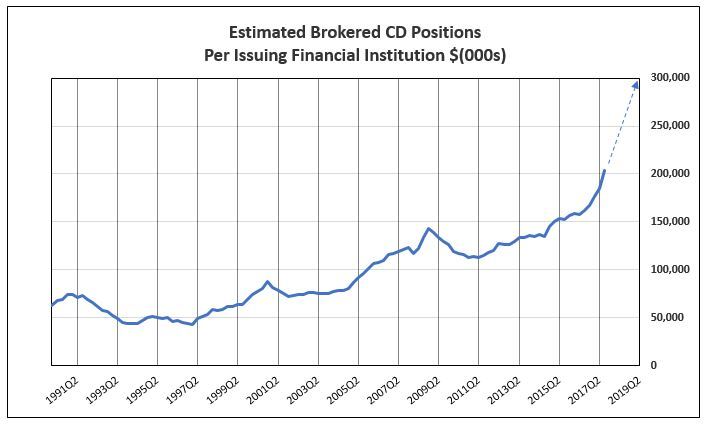
The growth dynamics in brokered CDs has been the increase in average brokered CDs per issuing bank from $40 million in 1997 to $180 million in 2017. The growth has been due to the increase in insurance levels to $250,000 in July 2010, mergers of banks issuing brokered CDs, and strong growth in loans and deposits for the core banks issuing CDs. Using estimates of brokered CDs outstanding, IDCFP divided the estimate each quarter by the number of banks with brokered CDs outstanding. The level of brokered CDs per issuing bank peaked at $143 million in the 4th quarter of 2008. The per bank brokered CD outstanding average fell to under $120 million in 2010. Since then, the balance of brokered CDs per bank rose to a record $180.6 million in the 1st quarter of 2017. The growth in brokered CDs per issuing bank increased $3 million a quarter in 2016 to $10 million in the most recent quarter, and an estimated $11 million in the 2nd quarter of 2017 to an average balance of $191.4 million.
The number of banks with outstanding brokered CDs averaged 1,280 in recent quarters. As tax cuts, infrastructure spending, and other government initiatives drive rising spending, GDP growth expands toward 3% a year and bank lending begins to grow, as does the volume of time deposits and banks issuing brokered CDs. Brokered CDs outstanding are now 19.4% of their respective time deposits, up from 15.1% in the 4th quarter of 2008. The proportion of outstanding brokered CDs as a percent of time deposits of banks issuing CDs has grown consistently each quarter from 2008 to 2017, and is projected to reach 24% in 2019.
IDCFP estimates brokered CDs per issuing bank will rise to $280 million by 2019 (see chart below). The number of banks with outstanding brokered CDs could expand to 1,400. Estimated brokered CD balances would then rise to $392 billion in 2019, a 60% increase from the 2nd quarter of 2017 estimate of $245 billion.


