Cost of Equity (COE) – The Most Important Element in Appraising Value of Common Stocks
The cost of equity capital (COE), from IDC Financial Publishing, Inc.’s (IDCFP) viewpoint, is calculated as the 30-year T-Bond yield plus one-half of the 30-year T-Bond yield (for equity premium) plus 20% of the standard deviation of return on equity (for specific equity risk) for a stock market index, such as the S&P 500. The 30-year nominal T-Bond yield has an implied 30-year inflation rate. From the nominal COE, IDCFP calculates the real COE by subtracting implied inflation (30-year T-Bond yield less 30-year inflation-indexed T-Bond yield).
A recently updated book by McKinsey Consulting (June 16, 2015) in chapter 13 “Estimating the Cost of Capital”, they estimate the cost of equity (COE). McKinsey personnel wrote, “The cost of equity is the most difficult component of the weighted cost of capital. Academics and practitioners have proposed numerous models to estimate cost of equity, but none have been universally accepted. Furthermore, the dot-com crash of 2001 and financial crisis of 2007-2009 have made estimation of key ingredients a very serious challenge.”
McKinsey attempted to solve the COE riddle by using an index, the S&P 500, and adding historical market risk premiums to today’s interest rate, which incorporates today’s expected inflation. A second estimation method calculates cost of equity implied by the relationship between current share price and aggregate fundamental performance (ROE and growth expectations). The first method provided Blume estimate of market premium of 6.3%, on average, from 1900 to 2014. McKinsey decided that past market premiums were unusable. However, between 2000 and 2008, they adopted a nominal COE of 9.5%.
For the financial crisis of 2007-2009, the financial engineering of the Federal Reserve, negative interest rates abroad, and their impact on 30-year T-Bond yields distorted McKinsey’s COE calculation. McKinsey solved the problem by creating a synthetic risk-free rate for 30-year T-Bonds.
McKinsey applied the formula for estimating COE from price and fundamentals to the S&P 500 index, using the long-run ROE of 13.5% and long-run growth in real GDP of 3.5% to convert a given years S&P 500 median P/E into the COE. “After inflation is stripped out, the expected market return (not excess return) is remarkably constant, averaging 7%.” From 1962 to 2014, their real COE varied between 6% and 8%.
COE, as defined by IDCFP, less inflation was stable from 1990 to 1998, averaging 8% with a low of 6.7% and high of 9.3%. Following the decline in 30-year T-Bond yields, the real COE declined from 1998 through 2010 from 7.2% to 5.0%. The further drop in the 30-year T-Bond yield in 2012 to 2016 reduced real COE to 4% in 2013 and 2% in 2016.
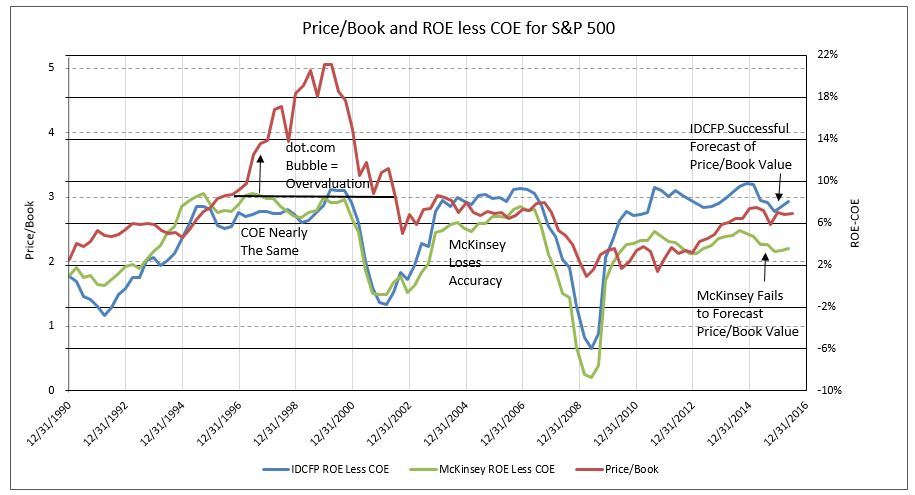
Using McKinsey’s real COE, averaging 7%, and adding the implied 30-year inflation rate, provides their nominal cost of equity capital. IDCFP plots our nominal COE compared to McKinsey’s estimated COE (see Chart I) and subtracts both from return on equity (ROE) for the S&P 500 and compares the spread to Price/Book value (see Chart II).
Rather than adopting the McKinsey average of 7% real COE, IDCFP relied on its definition using the 30-year T-Bond yields, as described above. IDCFP calculated that its nominal ROE less COE provides the best explanation of the S&P 500 price to book value (and, therefore P/E ratios) from 1990 to 2016 (even with overvaluations occurring in 1997 to 2002). McKinsey nominal estimates of COE of 8% to 10% from 2002 to 2016 fail to explain the consistent levels in price to book value for the S&P 500, as forecast by IDCFP’s nominal ROE less COE (see Charts I & II).
An individual company’s COE can vary around a stock index COE based on individual stock risk or beta. However, all individual stock’s COE remain dependent on the calculation for the overall market, i.e. S&P 500. Today’s 2.9% yield on 30-year T-Bonds, could well be 3.5% to 4.0% in 2017. But, these levels of yields fail to support the McKinsey 8.2% nominal COE or 6.5% real COE. If 2016 is an aberration in COE, it correctly prices the current 11.7% ROE for the S&P 500, as it did from 1990 to 2016 using IDCFP’s estimates of COE (see Chart II).
Chart I
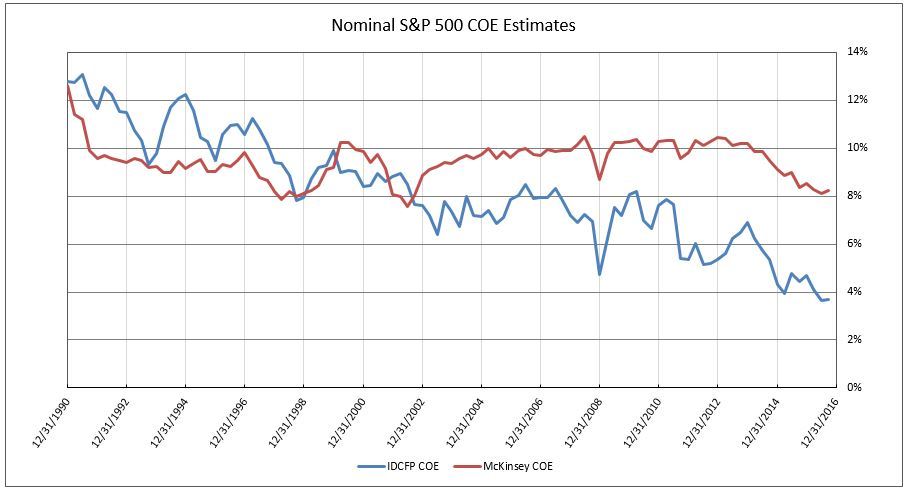
Chart II