ROE Less COE Spread Drives Performance of S&P 500
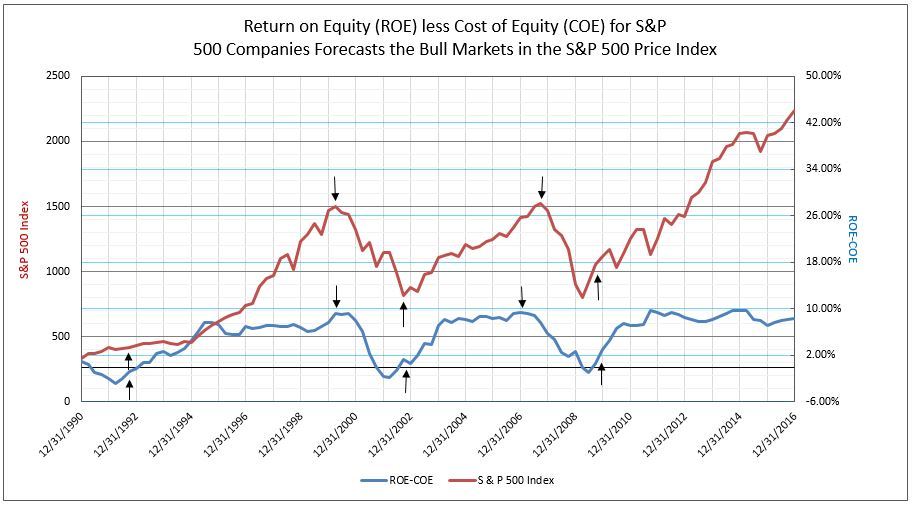
The S&P 500 stock market average index has had a remarkable history of tracking the recovery in the return on equity (ROE) above the cost of equity (COE) for its average of 500 component companies (see Chart I). Each time ROE has risen above COE, a bull market occurred as the spread between ROE and COE widened toward 10%, as in the late 1990’s, years 2002 to 2007, and the latest recovery from 2009 to 2016. To better understand the consistent performance to ROE less COE, IDC Financial Publishing, Inc. (IDCFP) examines the components.
Chart I
Return on equity (ROE) in Chart II demonstrates the profitability of America’s industry and companies. In the early 1990’s, ROE accelerated above the 10% COE in 1994 to profit highs of 18% at year-end 1999. Again in 2002, ROE rose above COE and accelerated to peak levels of 17.3% at the end of 2006. In the latest recovery, beginning in 2009 with ROE rising above COE, ROE accelerated to a peak of 14.8% in late 2011 and retested that level at year-end 2014, which set the stage for the latest bull market.
IDC Financial Publishing, Inc. normally only focuses on bank stock valuations, ROE, COE and price to book value. Given our unique “Cost of Equity” (COE), IDCFP tested the concept against the S&P 500.
Chart II
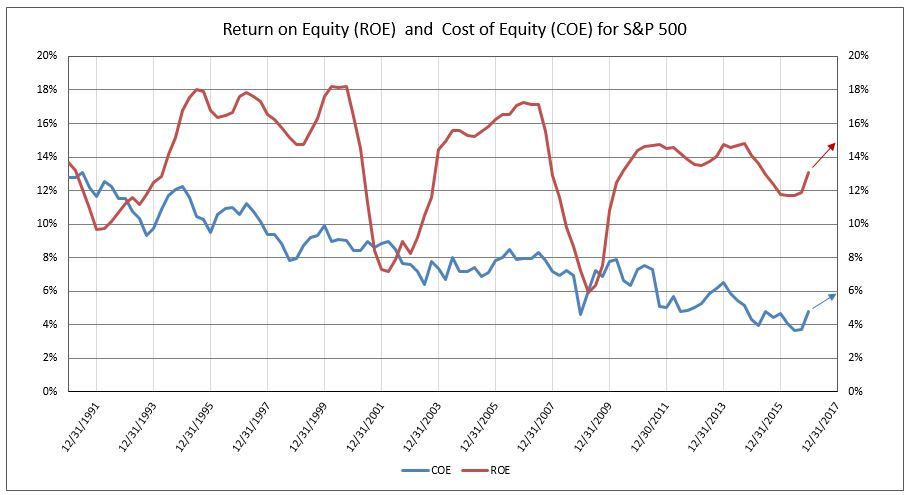
Beneath the cycle recoveries in ROE, however, was a secular decline in COE from the 12% level in 1990 to under 5% today. Despite the moderately lower peaks in ROE and the recent slowdown to under 12%, the consistent decline in COE drove the spread between ROE and COE and the last three bull markets (see Charts I and II). The COE as defined by IDCFP is the 30-year T-Bond yield plus one-half of this yield to account for an equity premium plus 20% of the standard deviation of the ROE, accounting for specific risk in the S&P average.
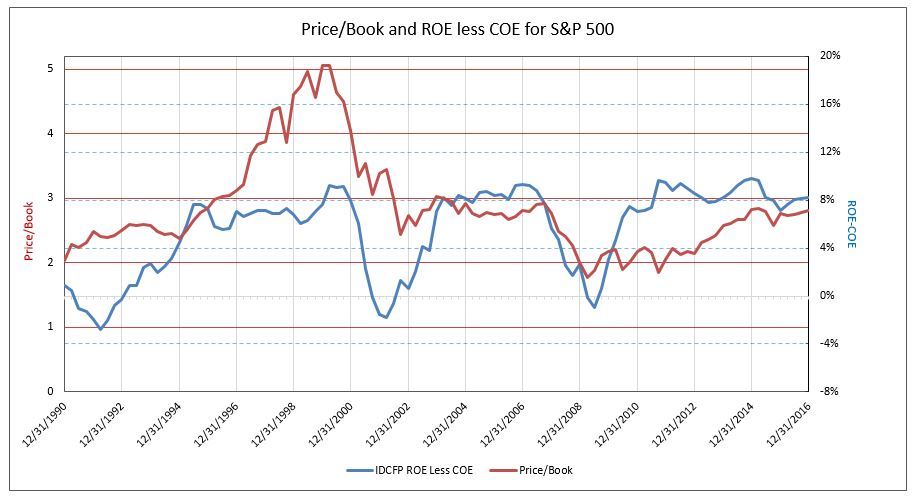
The recovery in the spread of ROE less COE to around 8% in 1995 to 1999, 2004 to 2006, and 2011 to 2016 provided peak valuations for the S&P 500 of around 3 times book value per share (see Chart III). In the bull market in the late 1990’s, price to book rose to 3 times in 1996, but then the tech boom took hold with valuation temporarily rising to 5 times book in 1999.
The price floor for corrections in the S&P 500 were normally 2.5 times book value per share. However, major declines in ROE, as occurred in 2008 and 2009, drove valuation of the S&P 500 to slightly below 2 times book value.
A rise in 30-year T-Bond yields to 3.5% to 4.0% and an increase in COE to 5.5% to 6.0% in 2017 requires an ROE of 13.5% to 14.0% in order to maintain a spread of 8% and provide strong price to book multiples of 2.8 to 3.0 times. Book value as of December 31, 2016, is estimated at 796. A continued economic recovery under the Trump administration forecasts book value to rise to 870 in 2017 and with a full year of corporate tax cuts in 2018 to, as high as, 1,000 (possibly?).
With the upside in pricing of the S&P 500 near 3 times book and the downside to only 2 times book, indexing to the averages has become a popular and successful investment strategy. For individual companies, on the other hand, high ROE less COE spreads have been rewarding, but a breakdown with ROE below COE has created a major risk in price to book declining below 1 times. Indexing diversifies the individual stock risk and selection, and, in the case of the S&P 500, has provided a superior and consistent performance, given ROE greater than COE.
Chart III
John E Rickmeier, CFA
President